


The Hang Seng High Dividend Index has continued to outperform the broader market this year
The Hang Seng High Dividend Index has continued to outperform the broader market this year, demonstrating more robust performance even in the context of recent market corrections. Looking at the investor structure, the high dividend segment of Hong Kong stocks has a higher proportion of Southbound funds, which provides strong support from capital inflows. The Southbound funds account for 31.48% of the Hang Seng Composite Index, while the Hang Seng High Dividend Yield Index has a Southbound funds ratio of 39.58%, significantly higher than the overall market. In terms of asset characteristics, the valuation of Hong Kong stocks is notably lower than that of A-shares, hence the dividend yield is higher, making the Hong Kong Stock Connect dividend assets more cost-effective. The following chart shows the total decline of the Hang Seng Index, Hang Seng Technology Index, and Hang Seng High Dividend Yield Index since 2024.
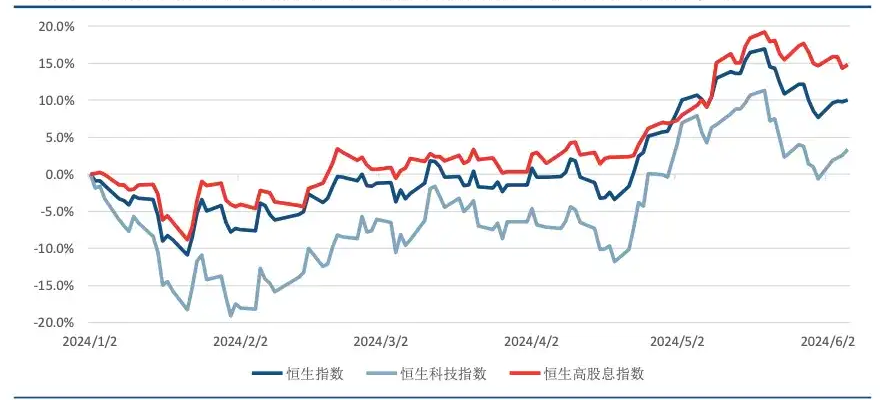 (Source: iFinD, CITIC Construction Securities, 2024.06.11)
How much advantage does the Hong Kong Stock Connect dividend rate have?
Hong Kong's dividend yield remains significantly higher than that of A-shares even after deducting dividend tax, making the Hong Kong Stock Connect dividend investment more attractive in terms of cost-effectiveness. As of May 31, the dividend yield of the China Securities Dividend Index was 5.2%, and the Hang Seng High Dividend Yield Index was 7.5%, which is still as high as 6.48% after deducting dividend tax. Based on the dividend yield calculation, the Hang Seng High Dividend Yield Index still has a safety margin of 24.32%. Looking at the AH share level, the after-tax dividend yield of H-shares is significantly higher than that of A-shares.
How much room is there for Hong Kong Stock Connect dividends?
After using various indicators for calculation, the Hang Seng High Dividend Yield Index still has a safety margin of 10-20%. Using the AH premium method (using the Hang Seng AH Stock Premium Index and the Hang Seng High Dividend Yield AH Stock Premium Index) and the valuation index method (PB and PE) for calculation, the safety margins of the Hang Seng High Dividend Yield Index are found to be 10.9%, 6.6%, and 41.5%, 12.3% respectively.
What are the characteristics of the Hong Kong Stock Connect Dividend Select Index?
The Hang Seng Stock Connect Dividend Select Index ("HSSCHYS") aims to reflect the overall performance of high dividend securities listed in Hong Kong that can be traded through the Stock Connect and apply the revised index calculation rules.
Features:
· The top 50 large and medium-sized Southbound Hong Kong Stock Connect shares are selected for the Hang Seng Stock Connect Dividend Select Index based on net dividend yield.
· The weight of the constituent stocks in the index is allocated according to the net dividend yield, thereby enhancing the index's rate of return.
· The index uses multifaceted screening to select companies with high dividends and sound financial conditions.
Performance of the Hong Kong Stock Connect Dividend Select Index
|
Index |
Index Level |
Change (Percentage) |
||||||
|
1 Month |
3 Months |
6 Months |
1 Year |
3 Years |
5 Years |
From the beginning of 2024 to the present |
||
|
Hong Kong Stock Connect Dividend Select Index (Dividend Cumulative Index) |
5,033.54 |
+7.20 |
+13.83 |
+15.30 |
+3.13 |
+9.68 |
+31.59 |
+9.57 |
|
Hang Seng Large and Medium (Investable) Index (Dividend Cumulative Index) |
3,984.44 |
+7.37 |
+15.92 |
+4.66 |
-7.42 |
-34.14 |
-27.07 |
+4,42 |
(Data source: Hang Seng Index, 2024.4)
Follow us
Find us on Twitter, Instagram, YouTube, and TikTok for frequent updates on all things investing.
Have a financial topic you would like to discuss? Head over to the uSMART Community to share your thoughts and insights about the market! Click the picture below to download and explore uSMART app!


Disclaimers
uSmart Securities Limited (“uSmart”) is based on its internal research and public third party information in preparation of this article. Although uSmart uses its best endeavours to ensure the content of this article is accurate, uSmart does not guarantee the accuracy, timeliness or completeness of the information of this article and is not responsible for any views/opinions/comments in this article. Opinions, forecasts and estimations reflect uSmart’s assessment as of the date of this article and are subject to change. uSmart has no obligation to notify you or anyone of any such changes. You must make independent analysis and judgment on any matters involved in this article. uSmart and any directors, officers, employees or agents of uSmart will not be liable for any loss or damage suffered by any person in reliance on any representation or omission in the content of this article. The content of this article is for reference only. It does not constitute an offer, solicitation, recommendation, opinion or guarantee of any securities, financial products or instruments.The content of the article is for reference only and does not constitute any offer, solicitation, recommendation, opinion or guarantee of any securities, virtual assets, financial products or instruments. Regulatory authorities may restrict the trading of virtual asset-related ETFs to only investors who meet specified requirements.
Investment involves risks and the value and income from securities may rise or fall. Past performance is not indicative of future performance.


More Content


