


本文來自:姚佩策略探索 作者:姚佩、馬浩然
報吿要點
1、下跌幅度、估值盈利匹配、業績預測上調三個視角,均指向成長是反彈主線。綜合來看,各視角行業篩選中重複度高的行業包括電子、家電、汽車、電力設備、傳媒、軍工。
2、覆盤:盈虧同源,反彈主線與領跌主線一致。 2015年以來上證急跌反彈共5次。①5輪急跌區間領跌風格為前4輪小盤成長、第5輪大盤價值;對應反彈主線,前3輪小盤成長、近2輪大盤成長,前後基本對應。②前三輪經驗,下跌幅度越深的行業,後續反彈幅度也越大,兩者相關性分別達到-0.8、-0.54、-0.55。③最近兩輪經驗,各行業反彈幅度與跌幅相關性減弱,原因在於經歷持續下跌及疫情意外衝擊後,市場轉而尋找代表中長期價值、短期景氣的方向。
3、視角1:跌的深、彈的猛,此輪下跌中成長、製造領跌。
4、視角2:估值盈利匹配度。方法1:對比PB-ROE、PEG長期分位水平,規避行業特徵。方法2:目前估值已處極低水平,未來2年業績高增,表明當下估值存在嚴重低估,估值修復彈性更強。
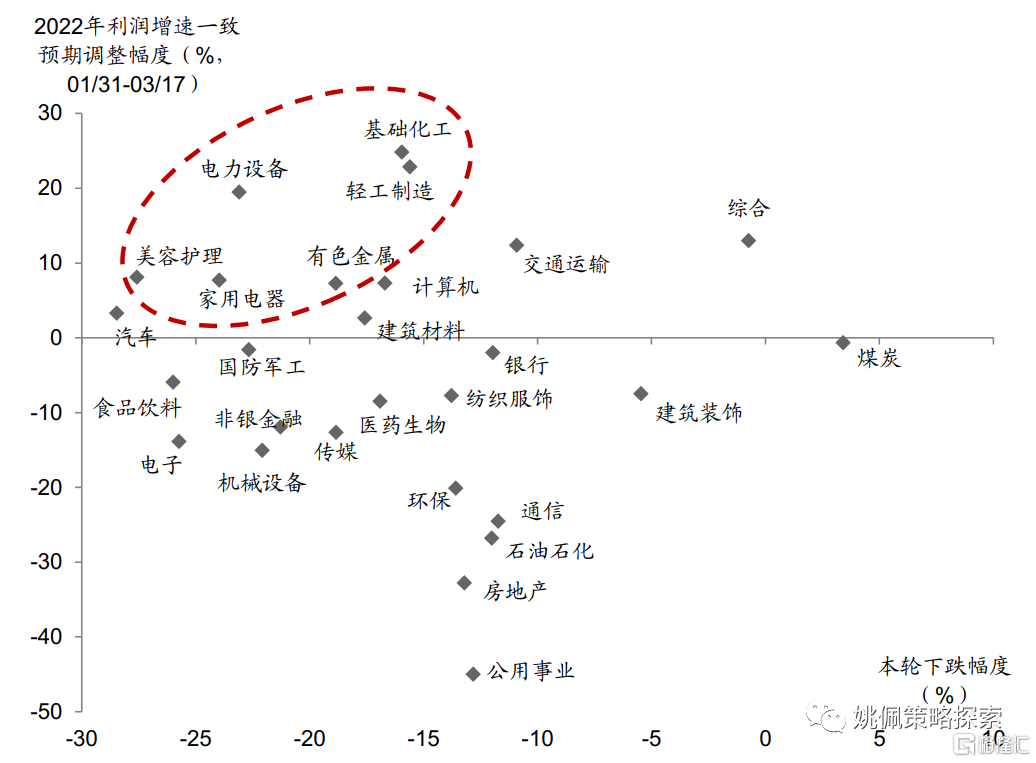
5、視角3:跌幅大,但上調22年業績預測。在2022年全A業績增速下滑背景下,近期仍在上調盈利預測(景氣超預期),同時股價調整充分的行業,有望迎來戴維斯雙擊,兩個角度刻畫:上調業績預測公司佔比;板塊整體業績預測變動。
正文
1. 三視角均指向成長是反彈主線
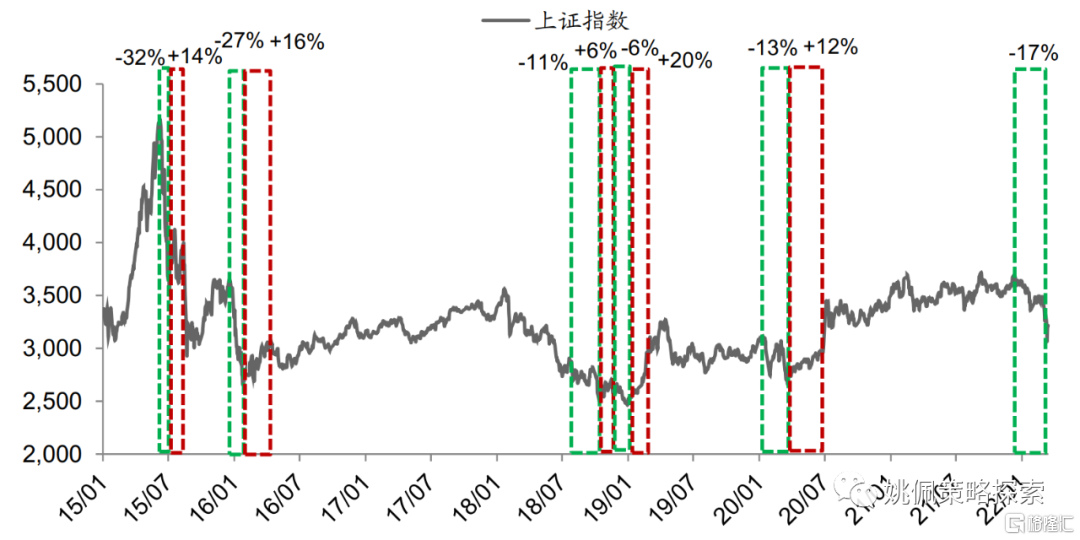
1.1 2015年以來的5輪急跌反彈區間
2015年以來上證急跌反彈共有5次:①2015/6/15-7/8(-32%)VS 2015/7/9-8/17(+14%);②2015/12/23-2016/1/28(-27%)VS 2016/1/29-4/15(+16%);③2018/7/24-10/19(-11%)VS 2018/10/20-11/19(+6%);④2018/11/19-2019/1/4(-6%)VS 2019/1/5-3/4(+20%);⑤2020/1/14-3/19(-13%)VS 2020/3/20- 2020/7/1(+12%)。
數據來源:Wind,東吳證券研究所
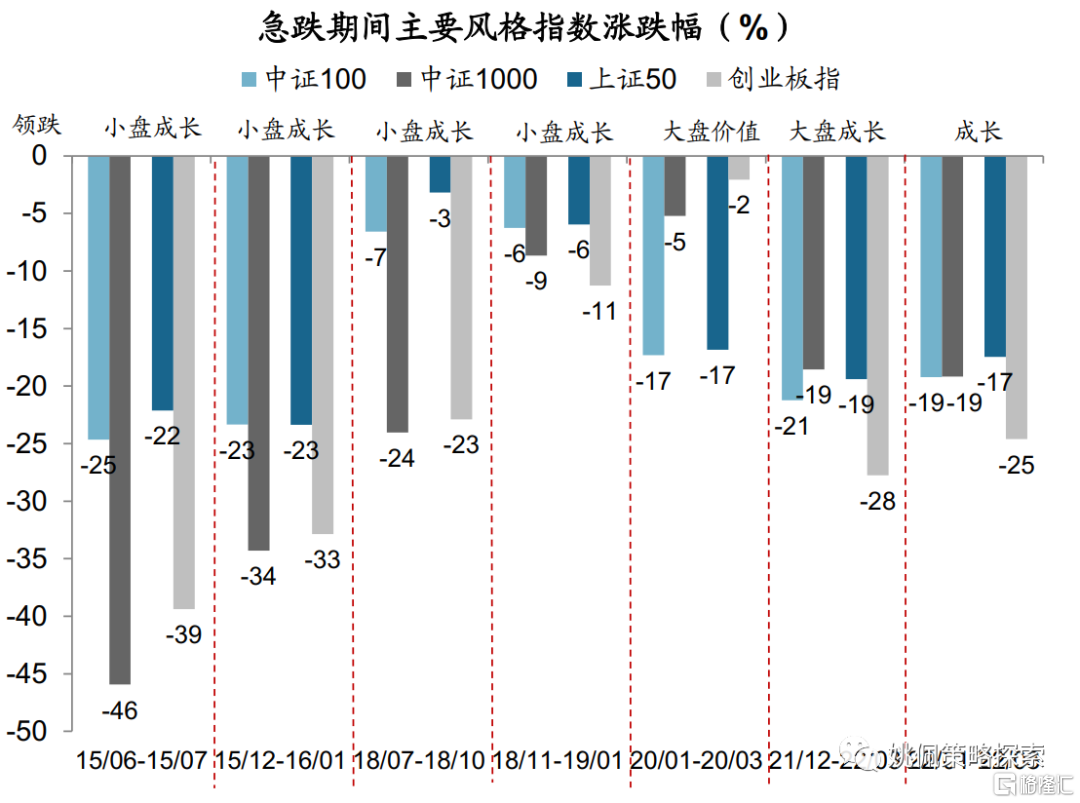
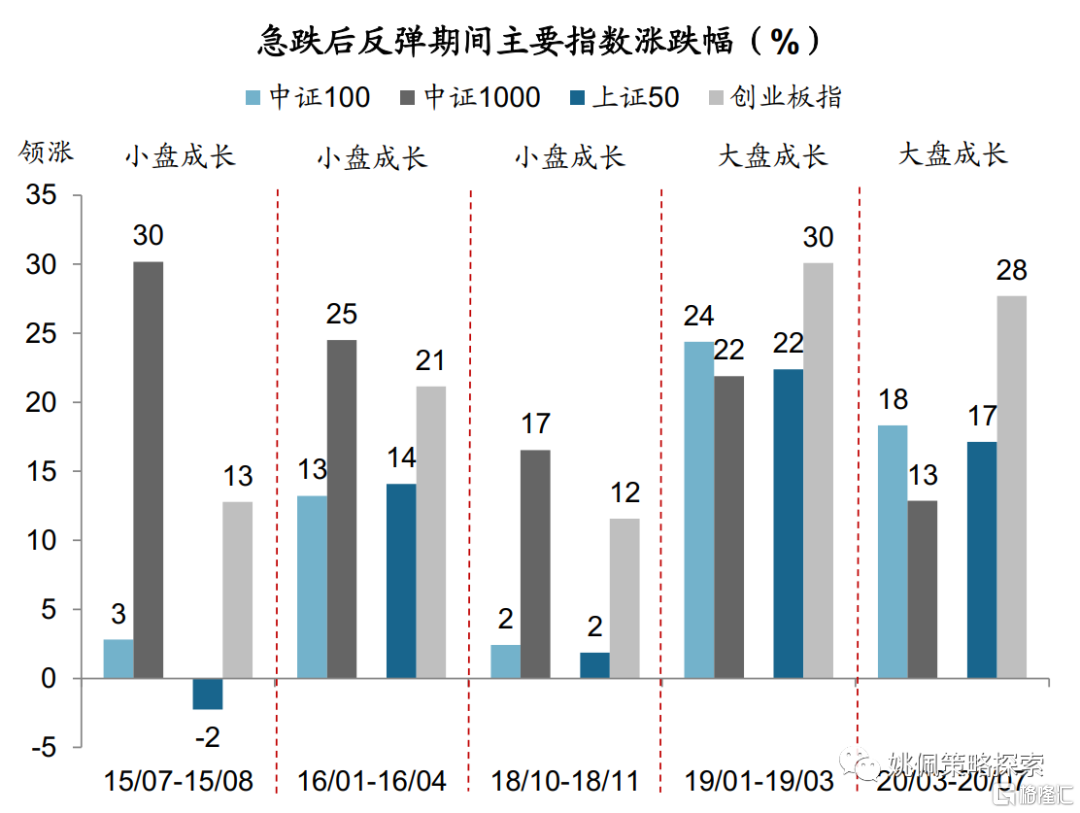
1.2 覆盤:盈虧同源,反彈與領跌主線風格一致
反彈風格主線基本對應領跌主線。5輪急跌區間內領跌風格分別為前4輪小盤成長、第5輪大盤價值;對應後續反彈主線,前3輪小盤成長、近2輪大盤成長,前後基本對應。本輪下跌中,2021/12/13以來大盤成長領跌,2022/01/01以來成長領跌、大小風格沒有分化。
數據來源:Wind,東吳證券研究所
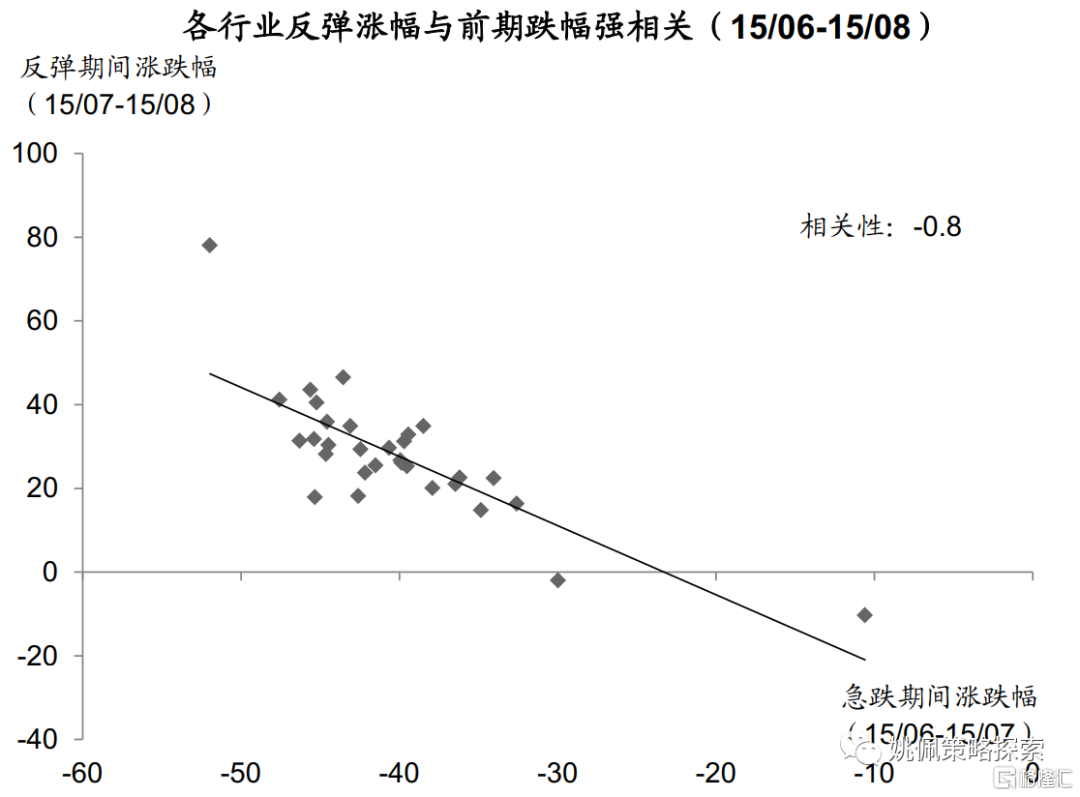
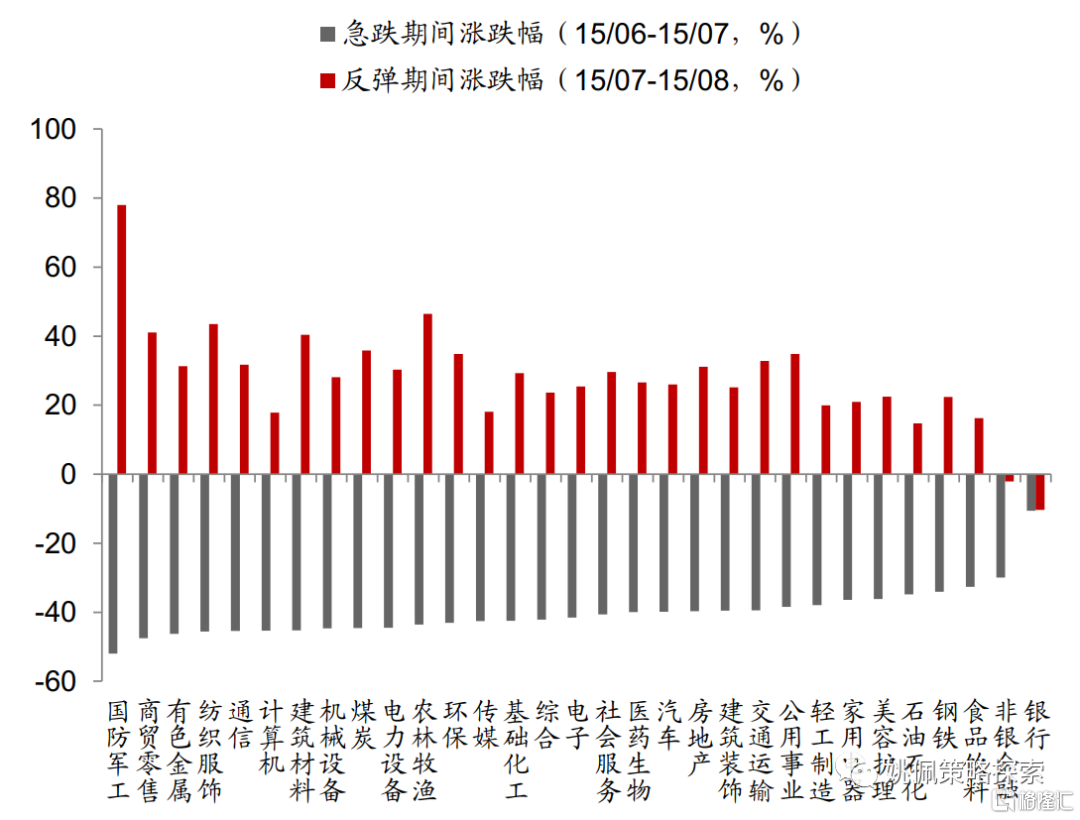
第一輪(15/06-15/08):各行業反彈幅度與前期跌幅相關性-0.8。第一輪經驗,下跌幅度越深的行業,後續反彈幅度也越大,兩者相關性達到-0.8。具體行業來看,軍工(-52%、+78%)、農業(-44%、+46%)、紡服(-46%、+43%)反彈力度最大,銀行(-11%、-10%)補跌。
數據來源:Wind,東吳證券研究所
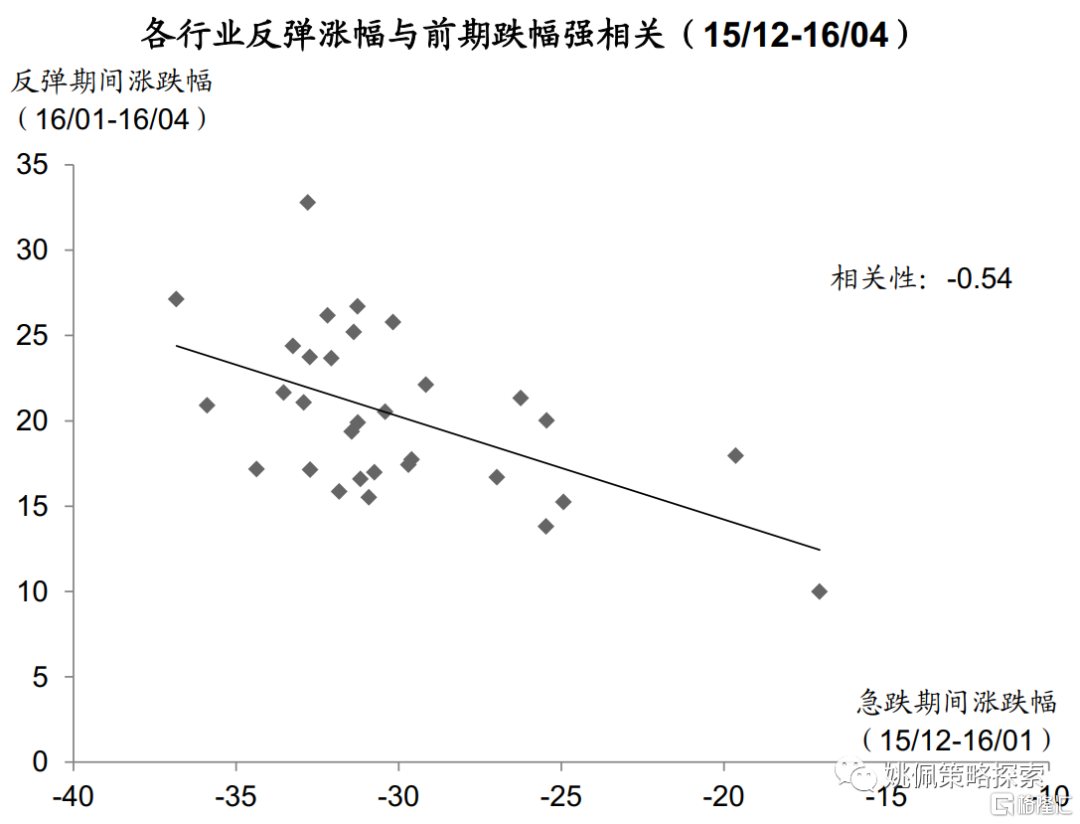
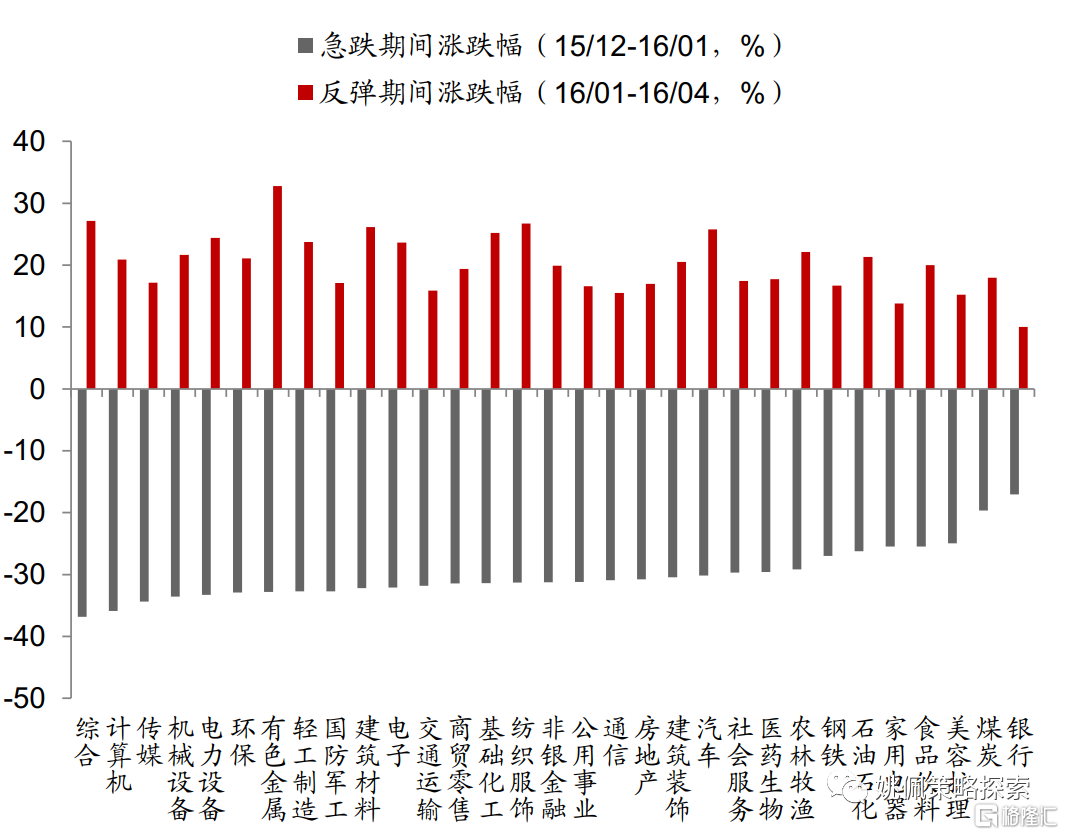
第二輪(15/12-16/04):各行業反彈幅度與前期跌幅相關性-0.54。第二輪經驗,同樣驗證下跌幅度越深的行業,後續反彈幅度也越大。具體行業來看,有色(-33%、+33%)、綜合(-37%、+27%)、紡服(-31%、+27%)反彈力度最大,銀行(-17%,+10%)反彈最小。
數據來源:Wind,東吳證券研究所
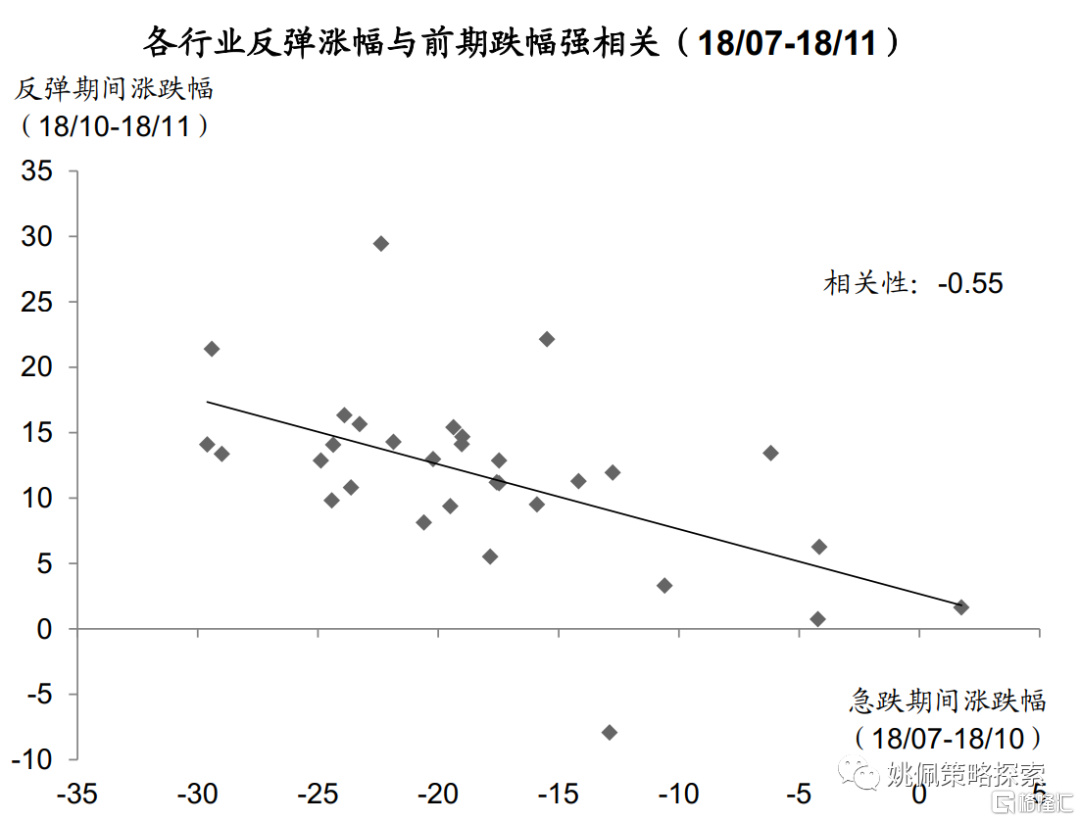
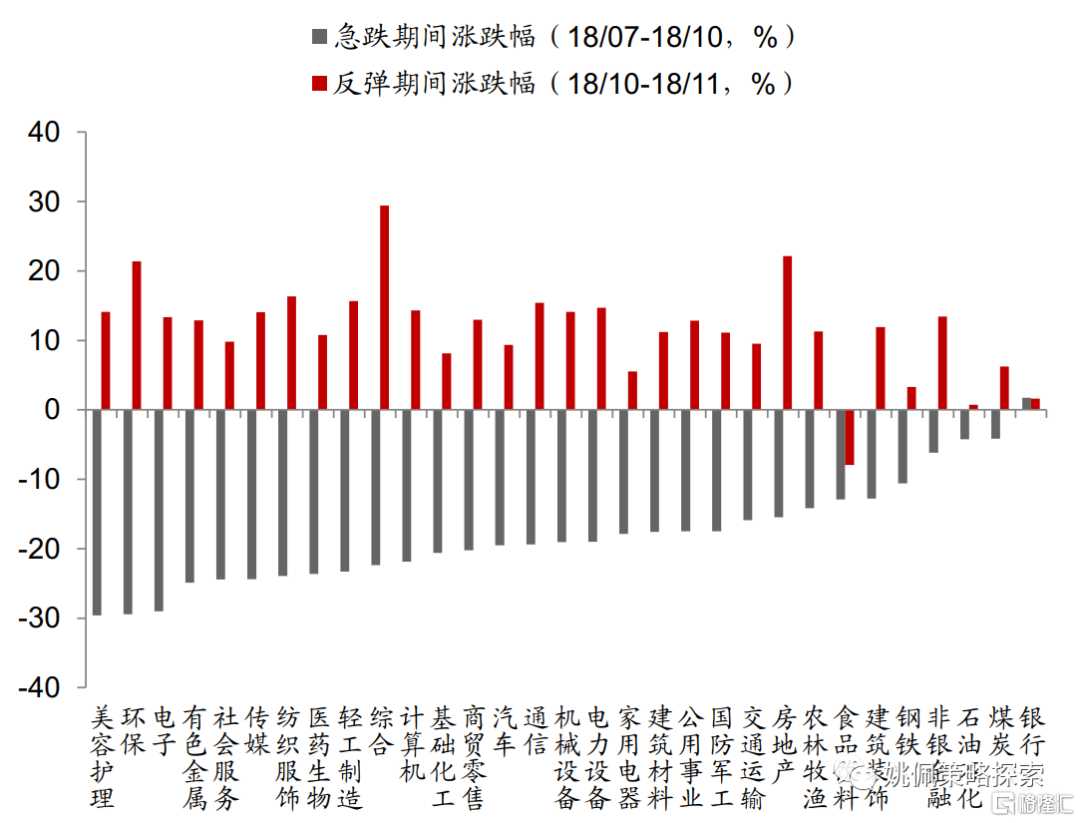
第三輪(18/07-18/11):各行業反彈幅度與前期跌幅相關性-0.55。第三輪經驗,同樣驗證下跌幅度越深的行業,後續反彈幅度也越大。具體行業來看,綜合(-22%、+29%)、房地產(-15%、+22%)、環保(-29%、+21%)反彈力度最大,食品飲料(-13%、-8%)補跌。
數據來源:Wind,東吳證券研究所
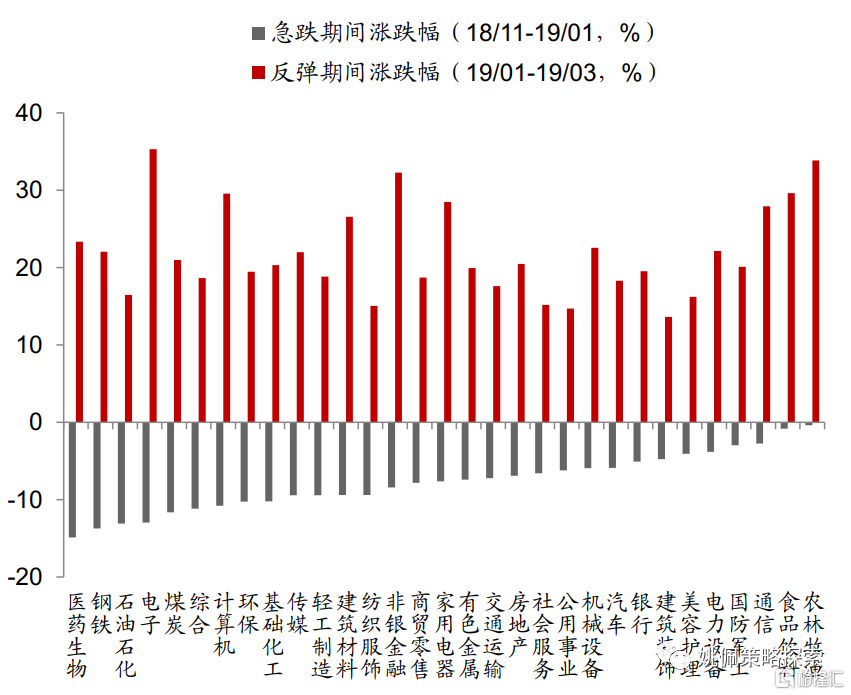
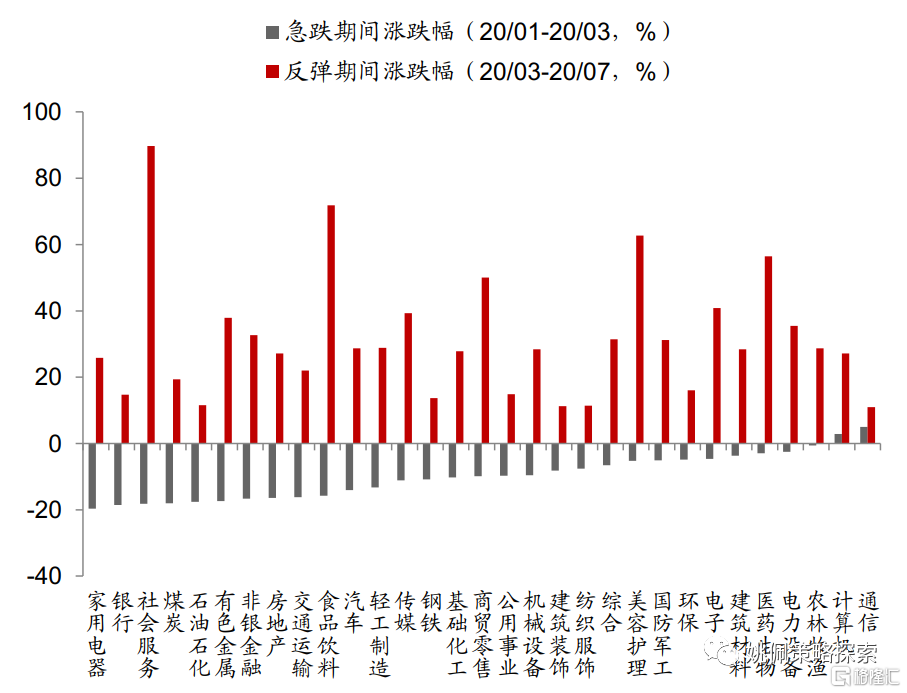
最近兩輪(18/11-19/03、20/01-20/07):各行業反彈幅度與跌幅相關性減弱。我們認為第四輪(18/11-19/03)原因在於經過2018年持續調整後各行業估值均處在極低水平,全年跌幅較大的電子、計算機,中長期價值凸顯的食品飲料、短期景氣回升的農業、非銀反彈力度較大;第五輪(20/01-20/07)原因在於疫情衝擊後,受疫情衝擊較小的食品飲料、美容護理,以及受益疫情的醫藥、零售(超市)反彈力度大。
數據來源:Wind,東吳證券研究所
1.3 視角1:跌的深、彈的猛,本輪成長、製造跌幅更深
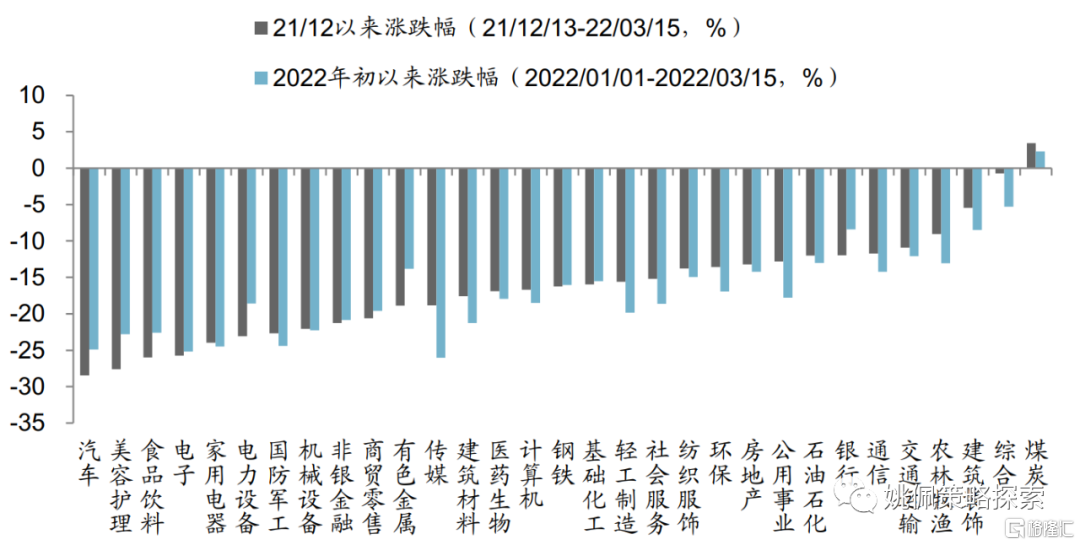
根據覆盤經驗,急跌中下跌幅度更深的行業,後續反彈幅度更大,此輪下跌中成長、製造領跌。
21/12高點以來汽車(-28%)、食品飲料(-26%)、電子(-26%)、家電(-24%)、電力設備(-23%)跌幅最大;
22年初以來傳媒(-26%)、電子(-25%)、汽車(-25%)、家電(-24%)、軍工(-24%)跌幅最大。
數據來源:Wind,東吳證券研究所
1.4 視角2:估值業績匹配
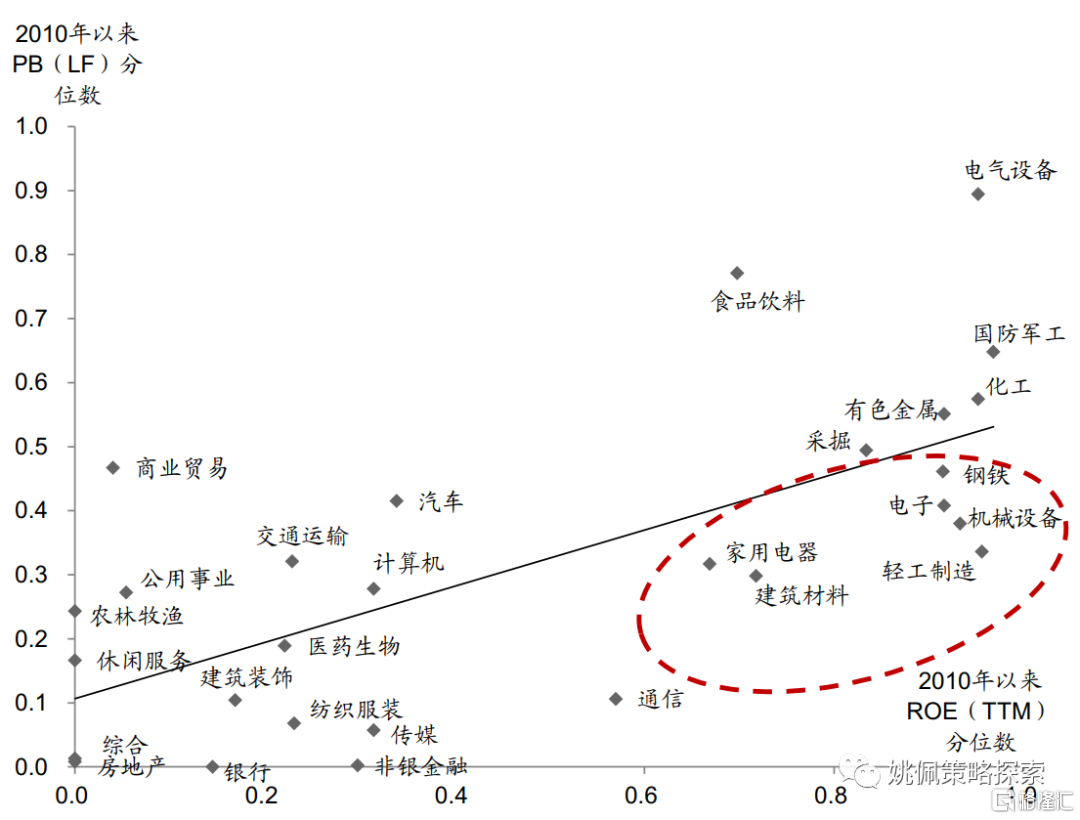
方法1:PB-ROE、PEG長期分位水平。對比各行業2010年以來估值、業績分位水平,規避行業特徵。
PB-ROE模型顯示鋼鐵、建材、機械、家電、輕工、電子佔優
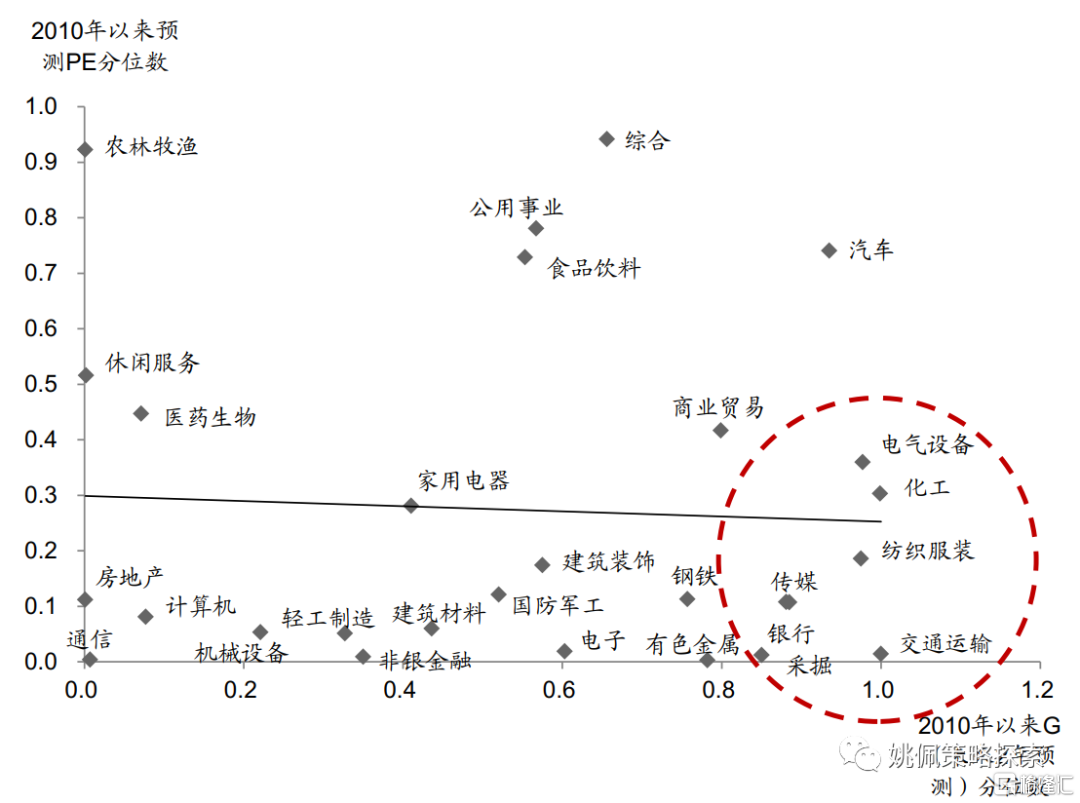
PEG(未來預測)模型顯示採掘、化工、交運、電氣設備、紡服、傳媒、銀行佔優。
數據來源:Wind,東吳證券研究所
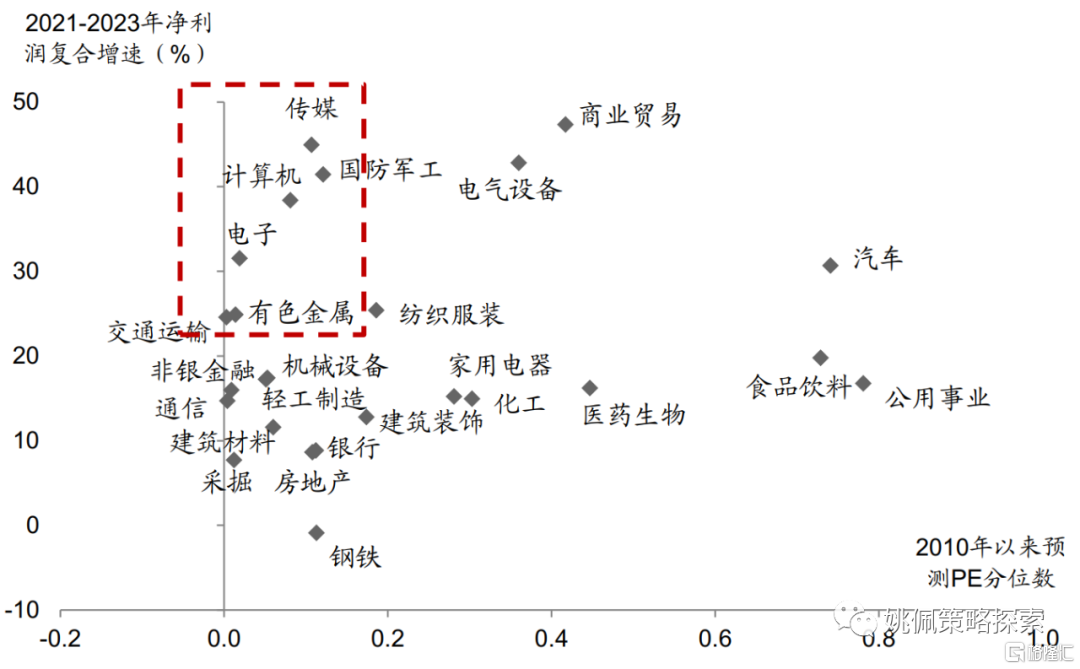
方法2:目前估值已處極低水平,未來2年業績高增。目前行業估值分位處在較低水平,同時未來2年有望實現業績高增,則表明當下估值存在嚴重低估,估值修復彈性更強。該模型顯示有色、軍工、交運、電子、計算機、傳媒更優。
數據來源:Wind,東吳證券研究所
1.5 視角3:跌幅大,但上調22年業績預測
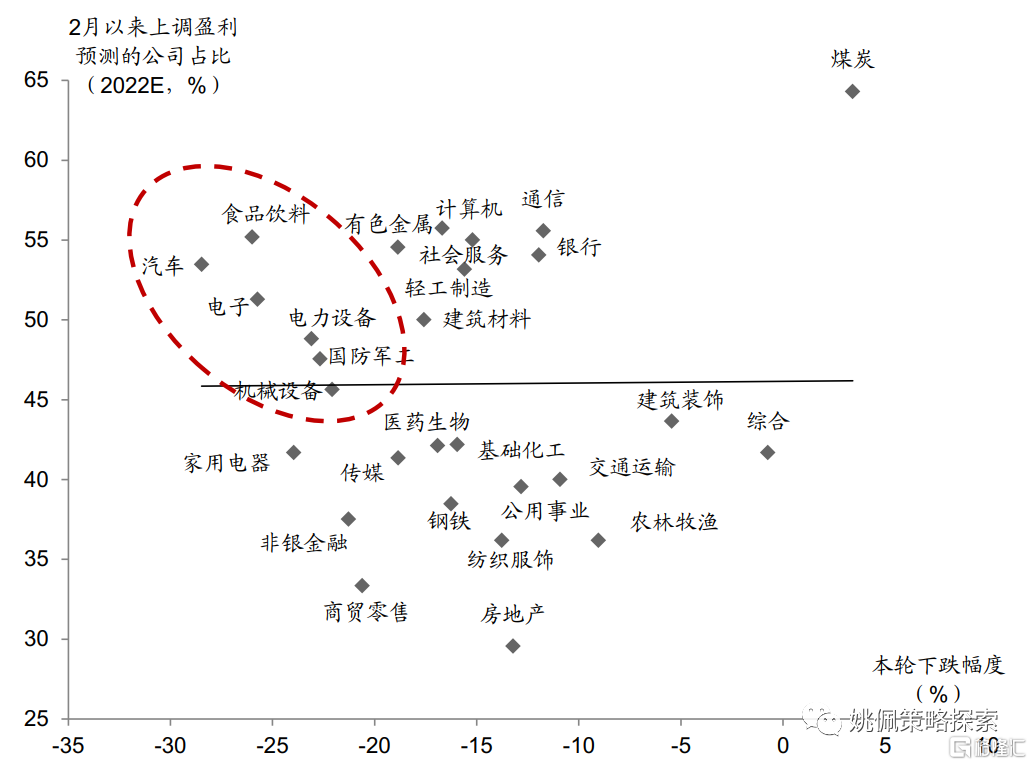
在2022年全A業績增速下滑背景下,近期仍在上調盈利預測(景氣超預期),同時股價調整充分的行業,有望迎來戴維斯雙擊,我們從兩個角度刻畫行業盈利預測變動。
①上調業績預測公司佔比更高行業:軍工、機械、電力設備、汽車、電子、食品飲料;
②板塊整體業績預測上調幅度更大:有色、化工、電力設備、輕工、家電、美容護理。
數據來源:Wind,東吳證券研究所
風險提示
政策推進不及預期;
歷史經驗不代表未來。
通脹超預期回升。


More Content


