翻倍之後必回撤!標普500以史上最快速度翻倍
來源:WIND資訊
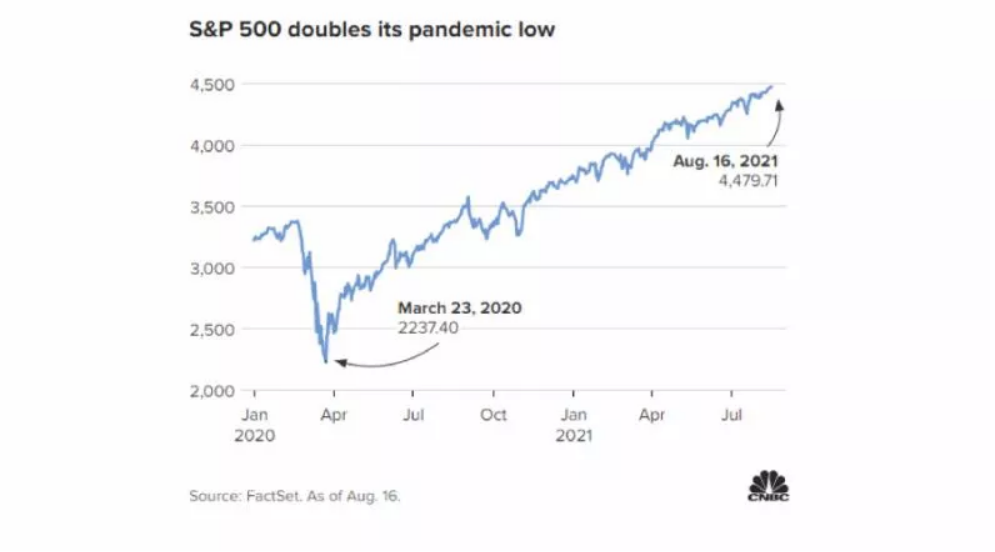
從去年3月,到今年8月,標普500指數一舉翻倍,這也是美股百年歷史上指數翻倍速度最快的一次,回顧歷史,翻倍後都會經歷不小的回撤,這一次呢?
2020年3月23日,標普500指數短期暴跌至2237點,但是在全球央行的力挽狂瀾下,美股大幅反彈,到今年8月16日,標普500指數最高來到4479點,相較當初低點已經翻倍,這一次只用了354個交易日,最快翻倍的一次。
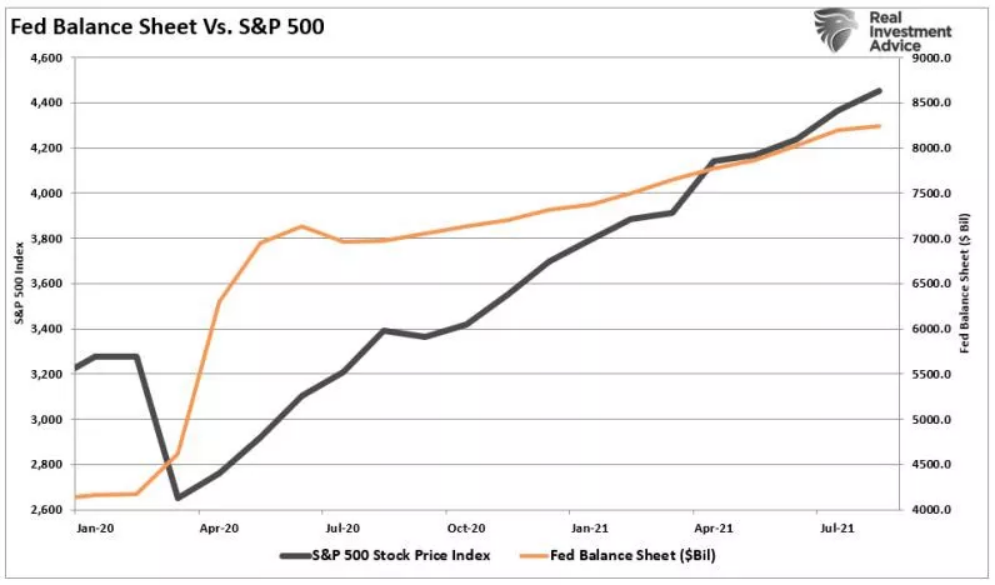
當然此次翻倍和經濟的迅速恢復沒有太大關係,金融市場迅速收復失地的最主要原因是美聯儲釋放的天量流動性,每月1200億美元購債規模依然在持續。
歷史上每次股指翻倍後續怎麼走?當然以前至少需要幾年時間才能翻倍。
根據Dr. Robert Shiller的數據,下圖紅色區域表示每次從低點翻倍,可以看出,每次翻倍後都會有一定的回撤。
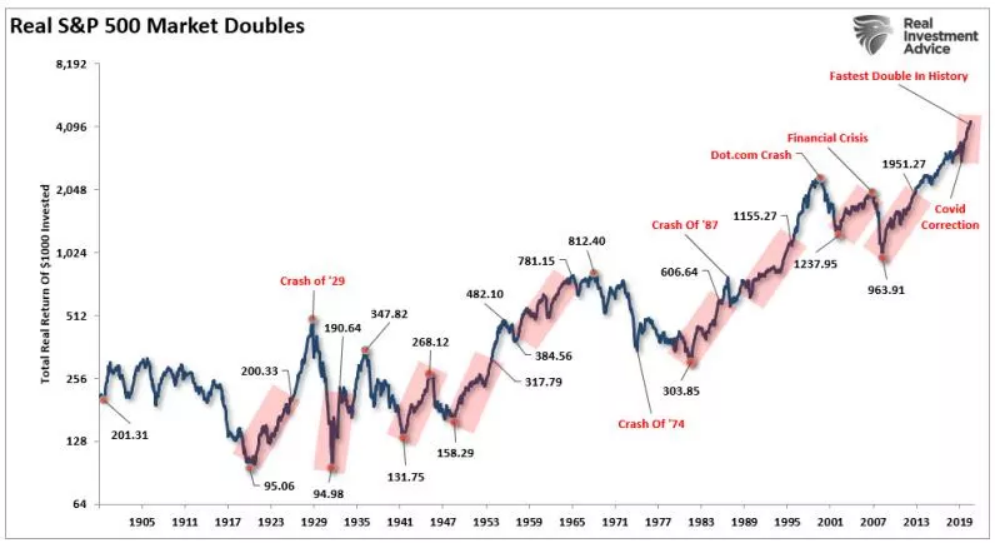
1974-1980:市場翻倍後出現了史上最嚴重的熊市,也是歷次翻倍後下跌幅度最大的,跌超200%。
1990-2000:翻倍後,出現了Dot.com崩盤。
2002-2007:互聯網泡沫爬出來後,又迎來金融危機。
2009-2020:流動性驅動此輪美股經歷了史上最長牛市,3月份美股以最快速度跌入熊市。
2020-至今:剛剛翻倍,盈利、經濟數據達到本輪頂峯。
所以,從歷史看,不斷上漲的市場,總是會遇到回撤甚至大熊市。最大區別是,下跌後的估值決定了再次上漲的幅度。現在主流分析師都認爲「標普500指數以最快速度翻倍」是未來繼續上漲的一個證明,但進一步攀升的阻力比許多人意識的要強很多。
首先是支撐本輪上漲最主要動力的美聯儲未來還會持續寬鬆嗎?投資者都在等待本週央行會議。另外通脹水平不斷提高,壓低企業利潤率。當然並不是建議投資者立刻清倉,已經形成「趨勢」的市場很難立刻扭轉,但確實需要風險管理。記住1998年時任美國SEC主席Arthur Levitt的經典名言:
「誘惑很大的時候,通常壓力也很大,放棄對數字的幻想。」
Follow us
Find us on
Facebook,
Twitter ,
Instagram, and
YouTube or frequent updates on all things investing.Have a financial topic you would like to discuss? Head over to the
uSMART Community to share your thoughts and insights about the market! Click the picture below to download and explore uSMART app!

Disclaimers
uSmart Securities Limited (“uSmart”) is based on its internal research and public third party information in preparation of this article. Although uSmart uses its best endeavours to ensure the content of this article is accurate, uSmart does not guarantee the accuracy, timeliness or completeness of the information of this article and is not responsible for any views/opinions/comments in this article. Opinions, forecasts and estimations reflect uSmart’s assessment as of the date of this article and are subject to change. uSmart has no obligation to notify you or anyone of any such changes. You must make independent analysis and judgment on any matters involved in this article. uSmart and any directors, officers, employees or agents of uSmart will not be liable for any loss or damage suffered by any person in reliance on any representation or omission in the content of this article. The content of the article is for reference only and does not constitute any offer, solicitation, recommendation, opinion or guarantee of any securities, virtual assets, financial products or instruments. Regulatory authorities may restrict the trading of virtual asset-related ETFs to only investors who meet specified requirements. Any calculations or images in the article are for illustrative purposes only.
Investment involves risks and the value and income from securities may rise or fall. Past performance is not indicative of future performance. Please carefully consider your personal risk tolerance, and consult independent professional advice if necessary.


