


 Investment CoursesSMIC Q1 Revenue Exceeds US$2.5 Billion, Q2 Guidance Beats Expectations as Hong Kong Shares Rise Nearly 5%
On May 15, Hong Kong-listed semiconductor stocks moved higher, with Semiconductor Manufacturing International Corporation (00981.HK) climbing nearly 5% intraday. As of publication, SMIC shares were trading around HK$75, with trading volume significantly expanding. Market attention centered on the company’s latest first-quarter results and a much stronger-than-expected second-quarter outlook.
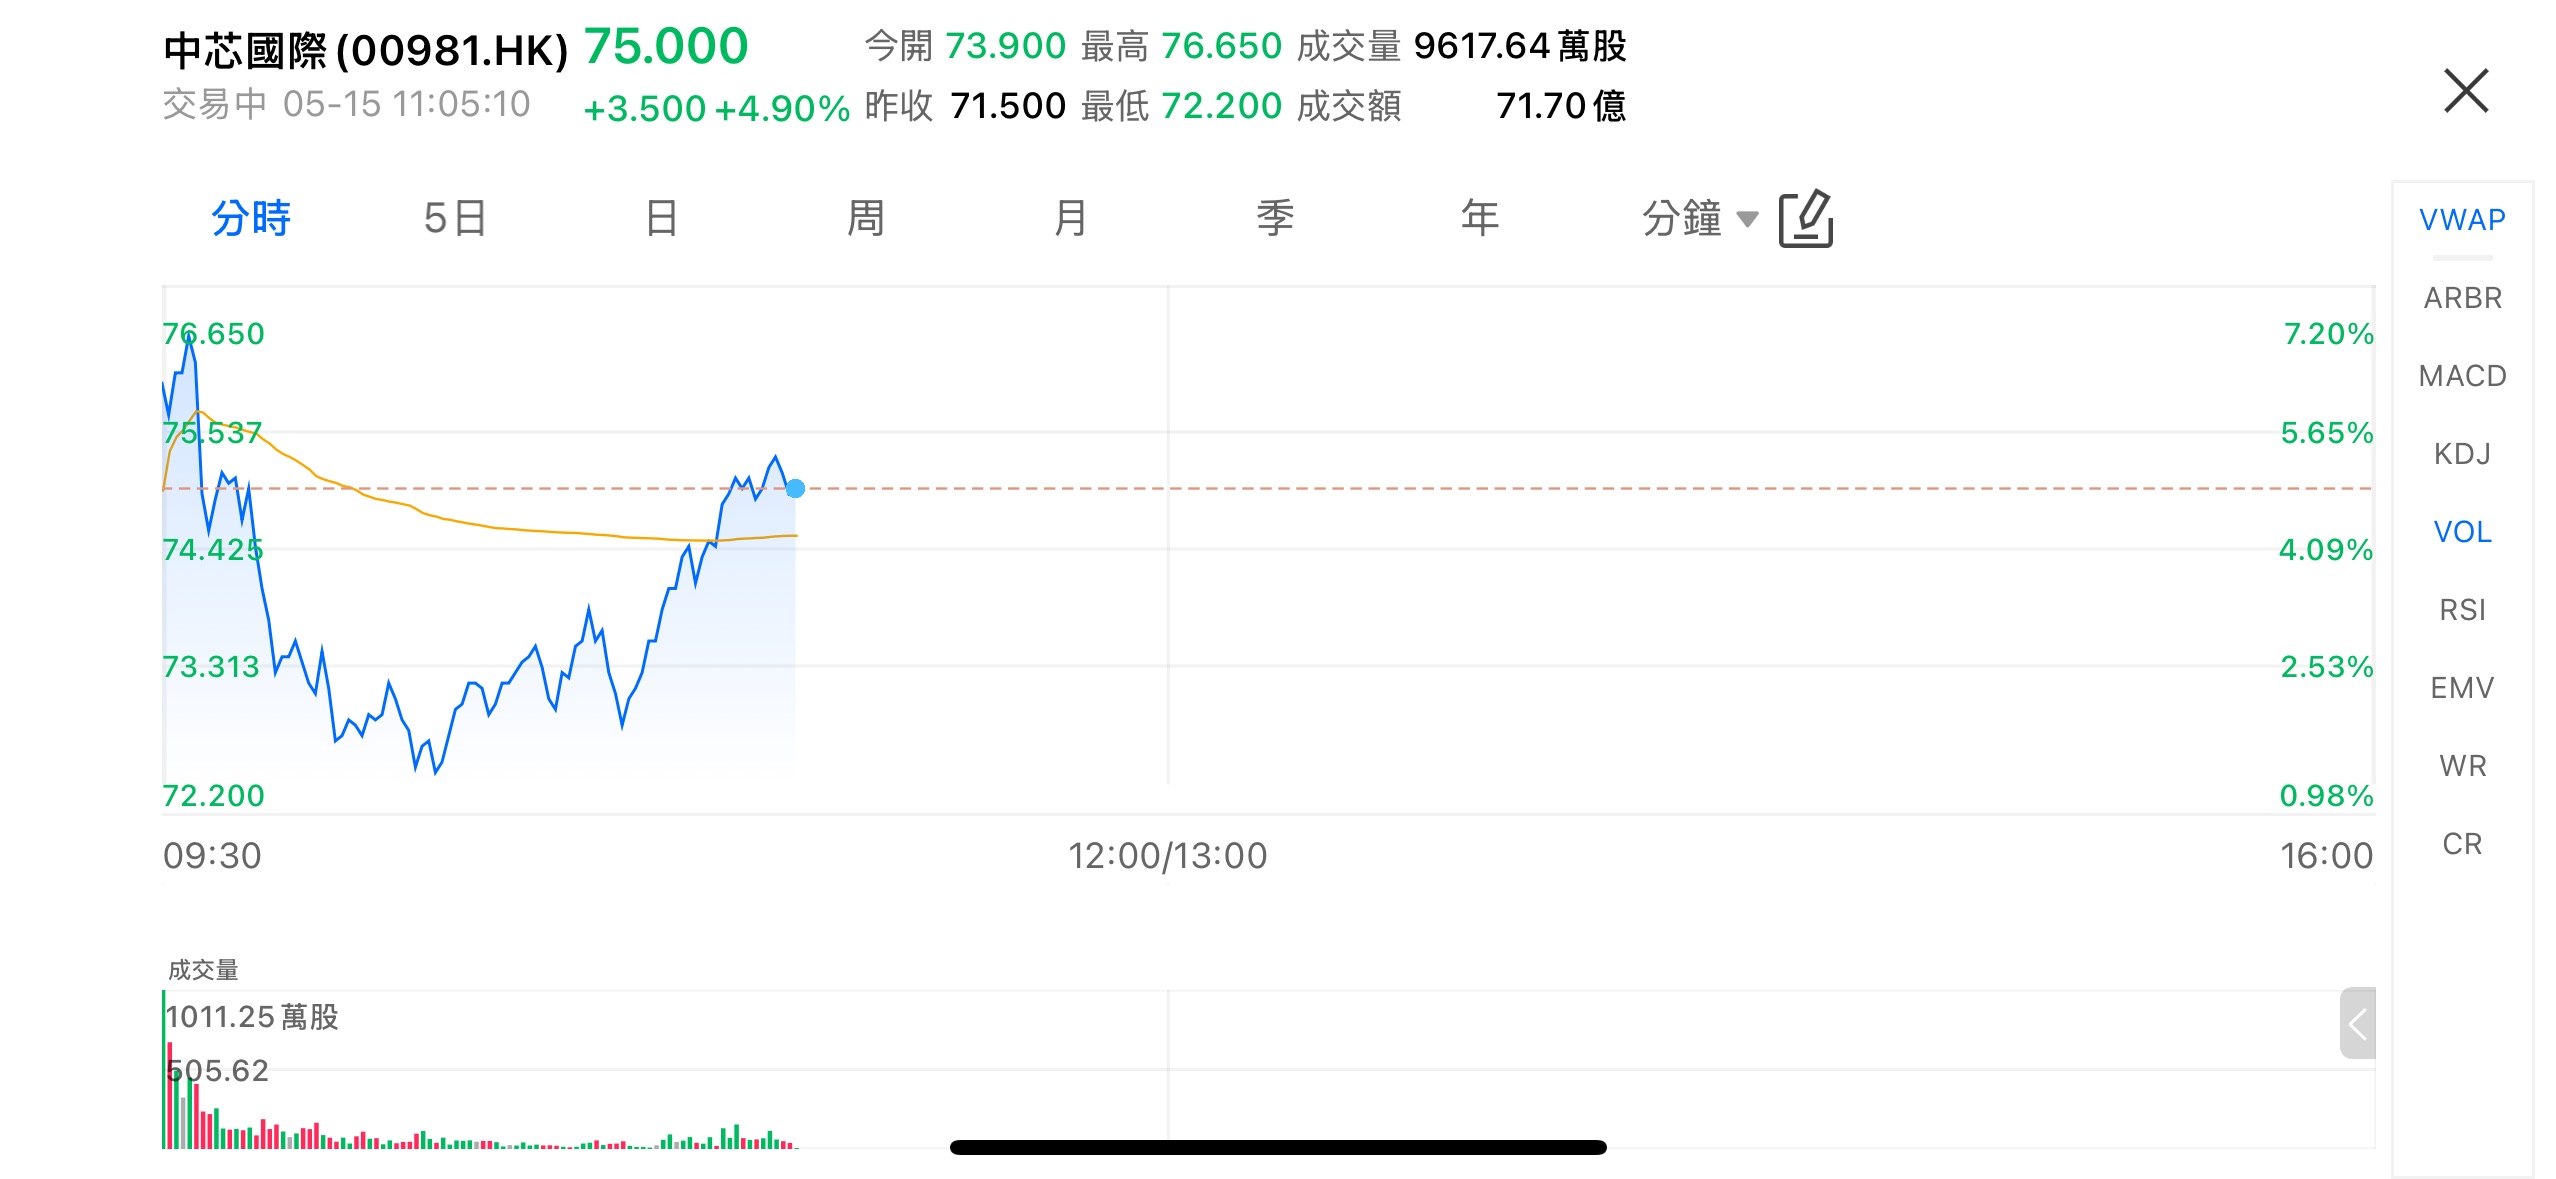
(Image Source: uSMART HK app)
Under International Financial Reporting Standards (IFRS), SMIC reported first-quarter 2026 revenue of US$2.505 billion, up 0.7% quarter-over-quarter. Gross margin reached 20.1%, improving by 0.9 percentage points from the previous quarter. The company expects second-quarter revenue to increase by 14% to 16% sequentially, with gross margin projected to remain between 20% and 22%, both above previous market expectations.
Q2 Guidance Beats Expectations as Management Turns More Optimistic
During the earnings conference call, SMIC management stated that, based on current customer demand and backlog visibility, “compared with the previous quarter, we are more optimistic about the company’s overall operations this year.”
Co-CEO Zhao Haijun said the improvement in first-quarter gross margin was mainly driven by product mix optimization and higher average selling prices. For certain products facing tight supply, the company has negotiated price increases with customers, and the pricing effect is gradually materializing.
At the same time, some customers have accelerated inventory buildup for consumer electronics and IoT-related products due to concerns over potential supply chain uncertainties, further strengthening SMIC’s order visibility.
The company expects both shipment volume and average selling prices to improve noticeably in the second quarter, becoming key drivers of revenue growth.
China Revenue Contribution Continues to Increase
From a regional perspective, China remained SMIC’s core growth market.
Revenue contribution from China increased to 88.9% in the first quarter, up from 84.3% a year earlier, while revenue contribution from the United States declined from 12.6% to 9.3%.
Against the backdrop of ongoing global semiconductor supply chain restructuring, domestic demand has become increasingly important for the company.
Meanwhile, SMIC’s industrial and automotive business posted strong growth. Revenue contribution from the segment increased from 9.6% in the same period last year to 14.0%, making it the fastest-growing application category. The trend reflects continued demand growth driven by electric vehicles, electrification, and industrial automation.
In contrast, smartphone-related revenue contribution declined from 24.2% to 18.9%, while the PC and tablet segment also recorded a lower share, highlighting continued changes in consumer electronics demand structure.
Cash Flow Improves Significantly as Capacity Expansion Continues
Under China Accounting Standards, SMIC reported first-quarter operating revenue of RMB17.617 billion, up 8.1% year-over-year. Net profit attributable to shareholders reached RMB1.361 billion, up 0.4%, while non-GAAP net profit attributable to shareholders rose 5.3% year-over-year to RMB1.232 billion.
Although declines in investment income and other gains weighed on total profit growth, the company’s operating cash flow improved significantly. Net cash generated from operating activities reached RMB5.132 billion during the quarter, compared with a net outflow of RMB1.172 billion in the same period last year, reflecting improved order recovery and cash collection.
As of the end of the first quarter, SMIC’s monthly capacity, measured in 8-inch equivalent wafers, reached 1.0783 million wafers, representing a year-over-year increase of approximately 10.8%. Capacity utilization rate stood at 93.1%, remaining at a relatively high level overall.
Capital expenditures totaled RMB10.871 billion during the quarter. The company’s balance sheet showed a decline in construction-in-progress assets alongside an increase in fixed assets, indicating that part of its previously expanded capacity has gradually been completed and put into production.
Overall, amid recovering demand for mature-node semiconductor manufacturing, continued localization of the domestic supply chain, and rising industrial and automotive demand, SMIC’s sharply raised second-quarter guidance has further strengthened market expectations for the company’s full-year growth outlook.
How to Buy SMIC on uSMART
After logging into the uSMART HK app, click the “Search” button in the top-right corner of the page, enter the ticker code (00981.HK), and navigate to the details page to view transaction details and historical trends. Click the “Trade” button in the bottom-right corner, select the trade type, and submit your order after filling in the transaction conditions.
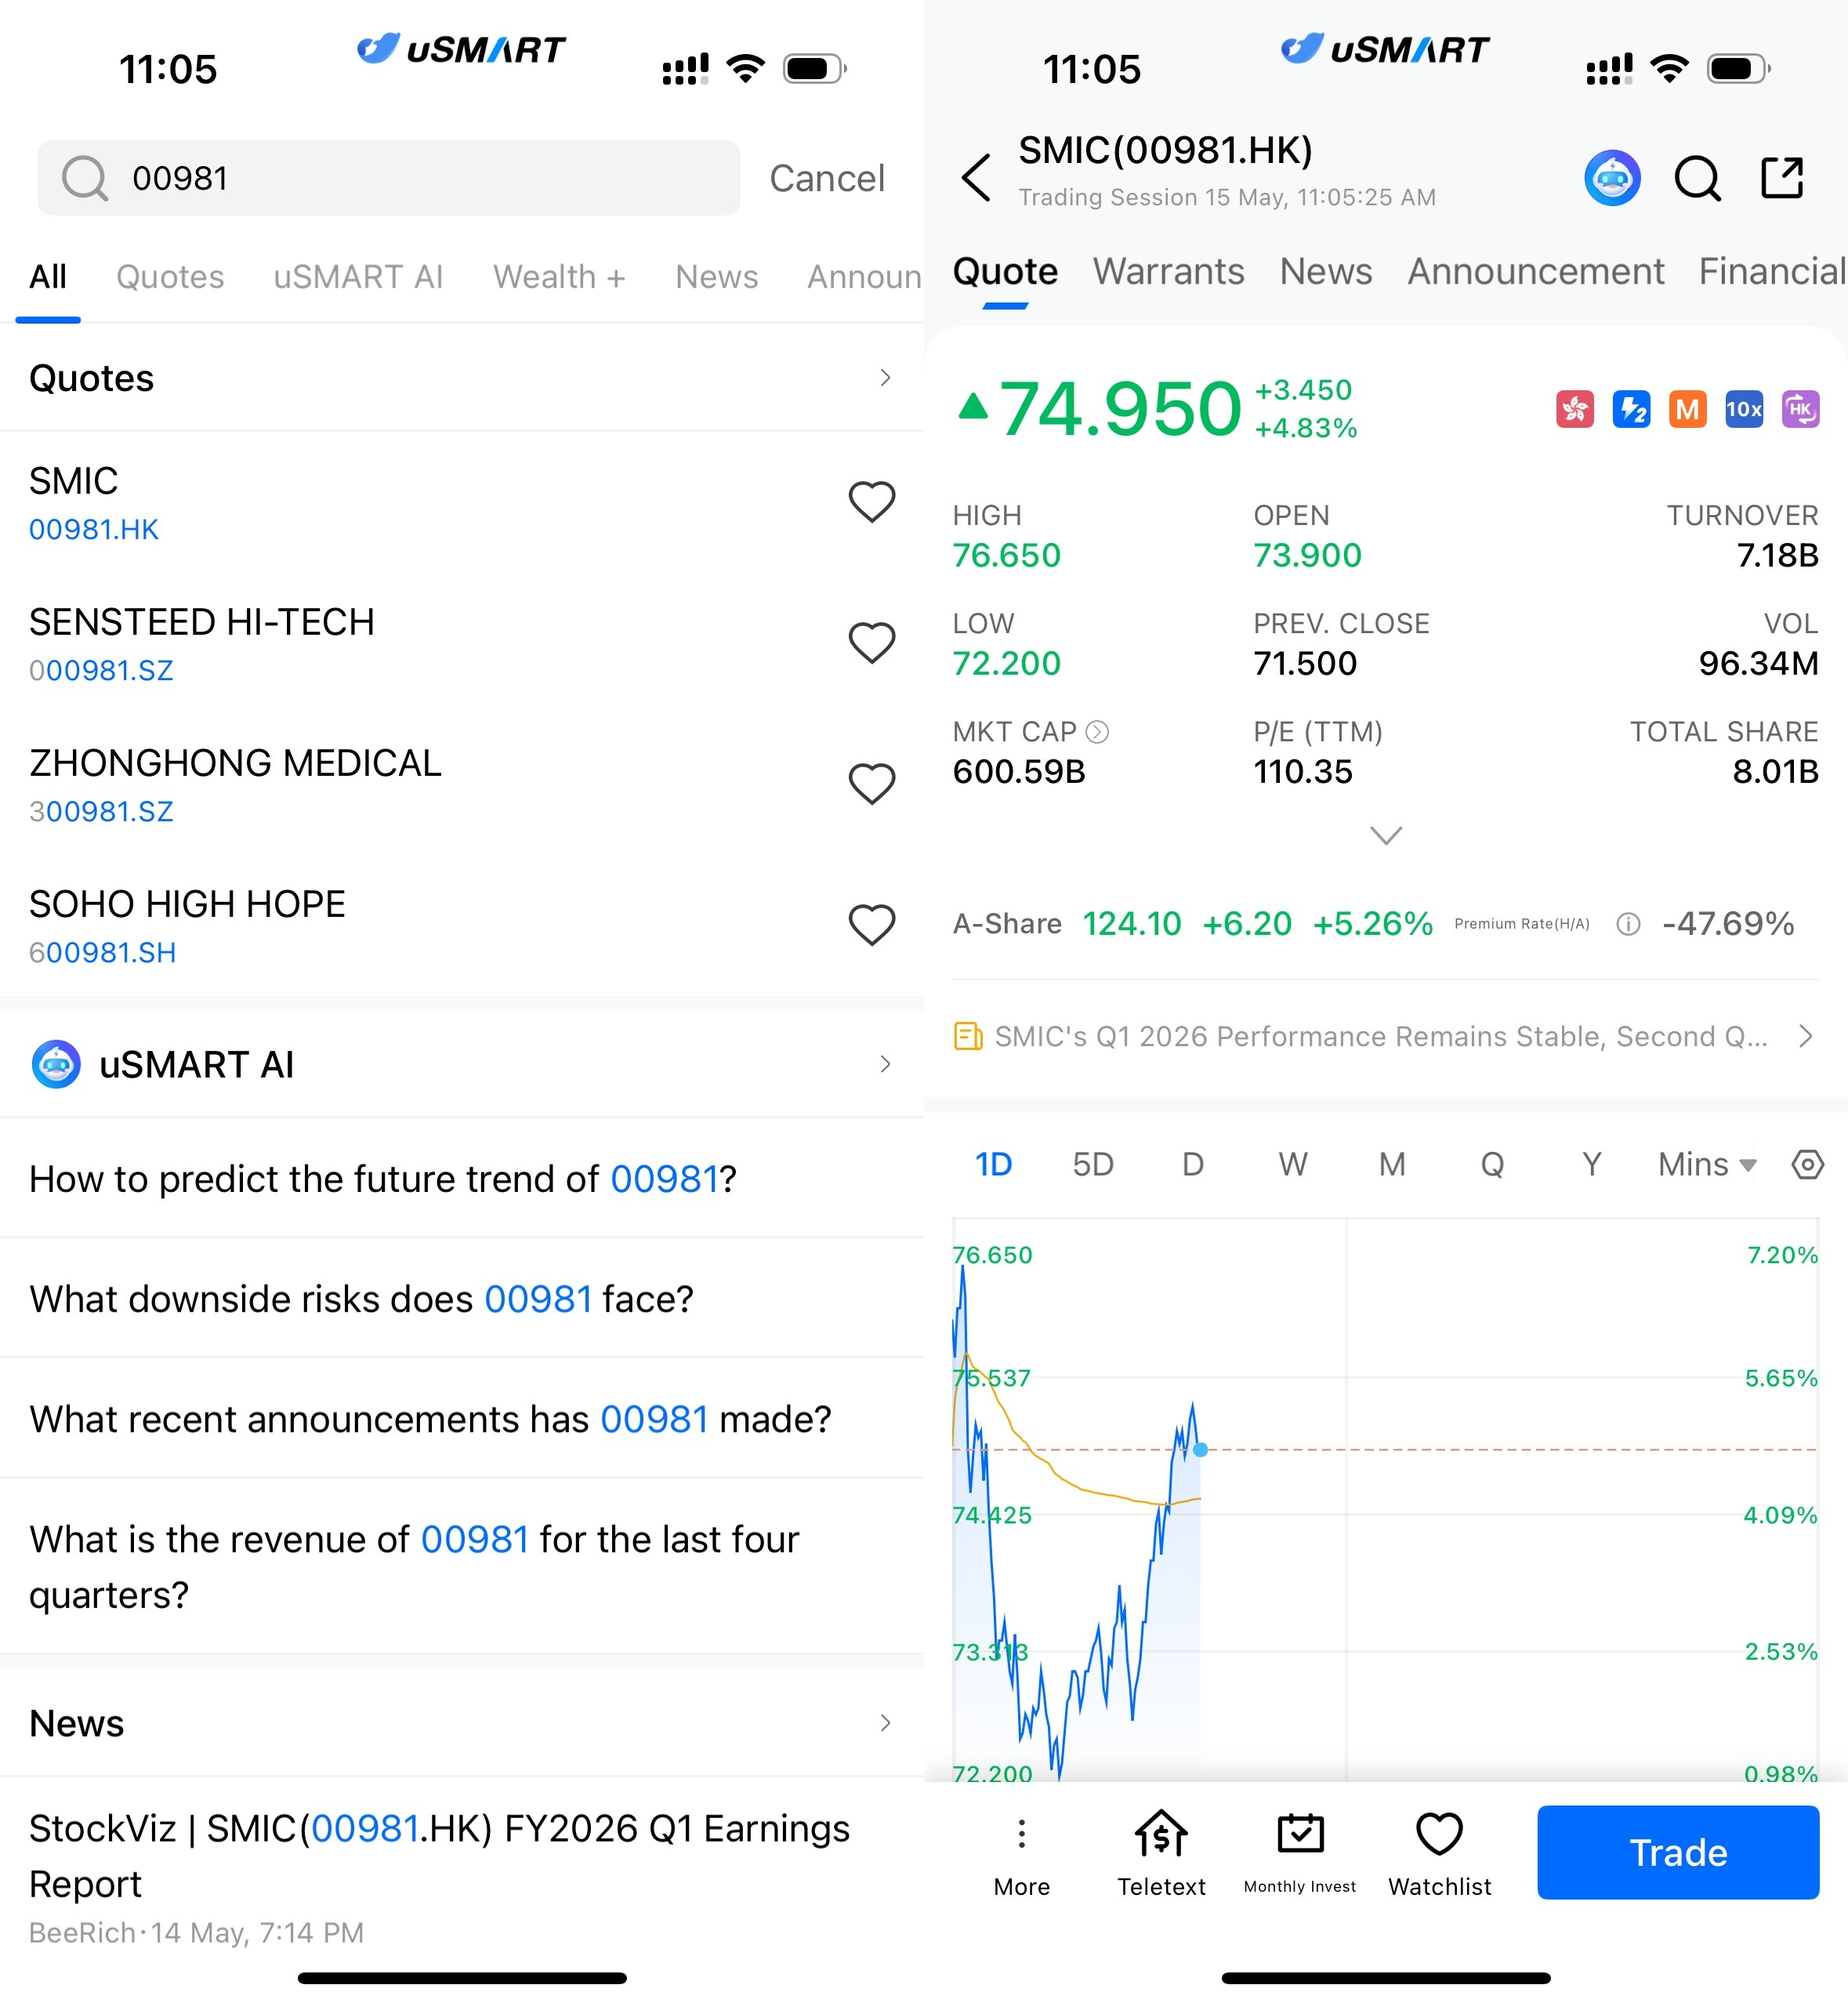
(Image Source: uSMART HK app)


More Content


