The recent equity correction stems mainly from elevated US Treasury yields compressing long-duration tech valuations, compounded by markets pricing further Fed tightening and US midterm uncertainty. The Nasdaq fell 4.5% in the week to 16 October, a de-rating rather than an earnings downgrade. Our key conclusions:
Macro: Treasury yields have peaked for this cycle; rate pressure is easingThe surge was driven by higher real yields and a wider term premium. The 10-year hit 5.37% on 7 October, the highest since 2002, then fell to 5.06% on 15 October despite hotter-than-expected September CPI (3.7%) and PPI (6.3%). With a December hike ~94% priced, strong auction demand and the term premium near a 10-year high, we expect a 5.0%–5.4% range, returning valuations to an earnings-driven regime.
AI sector: the upcycle remains intact; pullbacks are entry pointsTSMC's Q3 revenue rose 41% YoY in US dollars with a 66.4% gross margin, and Q4 guidance implies ~14% QoQ growth. Lumentum's quarterly revenue jumped 109% YoY as 1.6T transceivers entered volume production. We see the sell-off as rate-driven de-rating, not a cyclical peak, and favour accumulating core leaders on weakness.
HK internet: low valuations meet improving fundamentalsAlibaba's AI cloud revenue grew 45% and cloud EBITA 133%; Tencent's adjusted net profit rose 9%. Both trade at only ~13x forward P/E, with the Hang Seng TECH P/E near its 10th historical percentile. Peaking US yields and a firmer RMB should drive a re-rating; we favour building positions gradually.
Key Market Data
| Metric | Value |
|---|---|
| UST 10Y (7 Oct peak) | 5.37% |
| UST 10Y (15 Oct) | 5.06% |
| Fed funds target | 3.75%–4.00% |
| Sep CPI / Core CPI | 3.7% / 2.6% |
| Sep PPI YoY | 6.3% |
| Dec hike probability | ~94% |
Investment Highlights: UST yields have peaked for this cycle and valuation pressure is easing; the hiking path is largely priced. AI leaders such as TSMC and Lumentum remain in an upcycle, while HK internet leaders such as Alibaba and Tencent trade at low valuations. Both themes have entered a buying window.
Rate shock drove the correction; long-duration tech hit hardest
The 10-year yield rose ~50bp in September, its largest monthly increase since 2022, while the MOVE index climbed nearly 30%, lifting the equity risk premium. On the day September CPI was released (14 October), the S&P 500 and Nasdaq posted their biggest one-day falls since July. Highly leveraged AI infrastructure names such as CoreWeave and Oracle saw both equity and bonds sell off, with CoreWeave bond yields reaching ~15%. Ahead of the 27–28 October FOMC and the 3 November midterms, investors cut risk and rotated from AI hardware into defensive and value sectors.
Record yields: higher real rates and term premium expansion
The move was a bear steepening, with the long end rising more than the front end, signalling that investors demanded compensation not only for the Fed path but for duration risk itself. The 10-year rose from ~4.16% at the start of the year to ~5.37% on 7 October, up more than 120bp. Drivers include: (1) September FOMC minutes showing officials saw growth and AI investment beating expectations; (2) wider deficits and heavier Treasury supply, with interest costs of ~US$1.27trn in the first 11 months of FY2026; (3) hyperscaler 2026 capex of ~US$725bn, with tech bond issuance competing for long-term capital and, per investment bank estimates cited by LS Securities, adding ~30bp to yields this year; and (4) synchronised global tightening, Brent above US$100 and Middle East risk lifting inflation expectations.
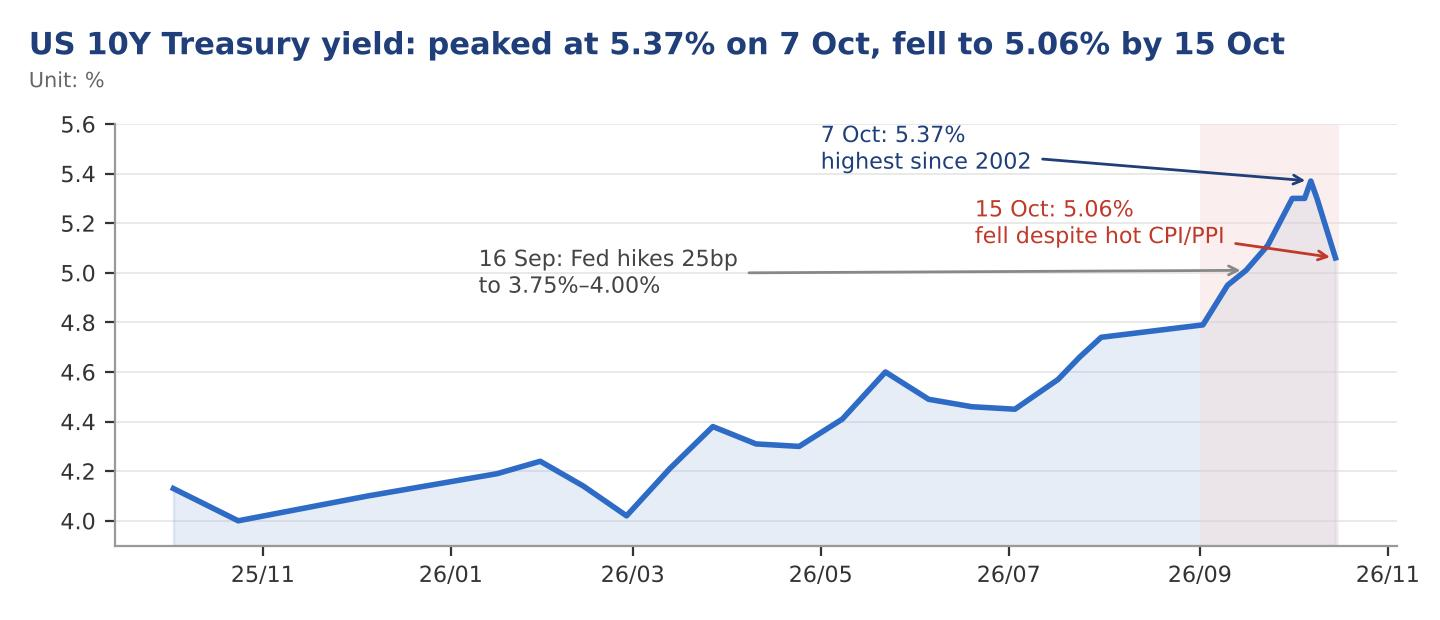
Source: US Treasury, YCharts, Reuters, investingLive, uSMART Research.
Five reasons we believe US Treasury yields have peaked
As the key variable weighing on equity valuations, we believe the 10-year yield formed a cyclical top in early October and will likely trade in a 5.0%–5.4% range, easing pressure on tech valuations:
| Dimension | Key evidence | Implication |
|---|---|---|
| Policy fully priced | December hike ~94% priced; ~90% probability of at least one more hike in 2026; Citi and others now call for a December hike | Diminishing marginal impact from the policy path; weaker front-end impulse |
| Price divergence | Despite hot September CPI and PPI, the 10-year fell from 5.37% to 5.06% (15 Oct) | Bad news no longer lifts yields; hikes are fully traded |
| Demand returning | 7 Oct 10-year auction (US$39bn) stopped at 5.30% with 2.77x bid-to-cover (0.23 above the 6-auction average of 2.54) and 80.3% indirect take-up; record ~US$19.8bn weekly bond fund inflow | Strong real-money demand near 5.3%; foreign and long-term buyers re-entering |
| Term premium elevated | 10-year term premium ~0.91% in early October, near a 10-year high; LS Securities sees the peak at 5.38%–5.52% between the October and December FOMCs | Limited room for further expansion; mean reversion more likely |
| Growth and safe haven | September payrolls only +29k; AI credit spreads widening and neocloud bonds sold, driving flows into Treasuries | Slowing momentum caps tightening; safe-haven demand anchors the long end |
Source: CME FedWatch, US Treasury, LSEG Lipper, LS Securities, investingLive, uSMART Research.
Fiscal supply and oil remain upside risks, so the top is more likely to be a high plateau than a sharp reversal. For equities, what matters is not a large decline in yields but an end to their rise: stabilising rates remove the persistent drag on long-dated valuations and put earnings growth back in the driver's seat.
Inflation surprise tightens policy, but the hiking path is largely priced
September CPI rose 3.7% YoY (consensus 3.6%, prior 3.4%), led by gasoline; core CPI rose to 2.6% (about 0.33% MoM), with 3-month annualised core near 3.4%, showing price pressure spreading from energy to core. PPI rose 6.3% YoY versus 5.3% expected, with components feeding directly into core PCE. After the data, October hike odds jumped from ~22% to ~47% before easing to ~30%, while a December hike is ~94% priced. Another hike this year is consensus; the only question is October or December, so the meeting itself should add little new shock. Gold rebounded 1.3% on 15 October and HK tech recovered on 16 October, early signs that the bad news is priced in.
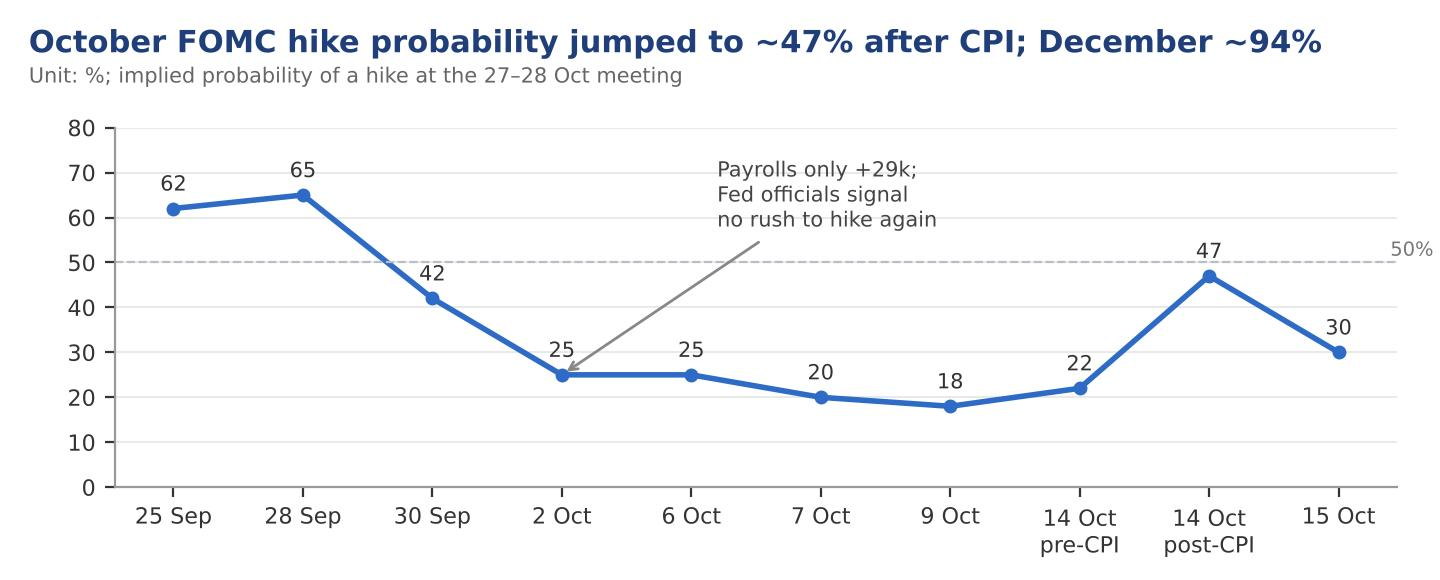
Source: CME FedWatch, Polymarket, Reuters, uSMART Research.
Opportunity 1: AI supply-chain leaders remain in an upcycle
The AI pullback reflects rate-driven de-rating, not a turn in the industry cycle. The four hyperscalers guide 2026 capex at ~US$725bn (+77% YoY), and BofA and Evercore expect over US$1trn in 2027; hyperscalers added ~US$700bn in remaining performance obligations over the past two quarters, so capex is backed by orders. Two leaders in compute and optical interconnect illustrate the strength:
| Metric | TSMC (TSM) | Lumentum (LITE) |
|---|---|---|
| Latest quarter | 3Q26 (Jul–Sep 2026) | 4Q FY26 (to June 2026) |
| Revenue | US$46.7bn, +41.2% YoY (NT$ +50.9%), +16.2% QoQ | US$1.006bn, +109.3% YoY, +24.5% QoQ |
| Profitability | GM 66.4%, OPM 58.7%, net profit +68.7% YoY | Non-GAAP GM 50.4%, OPM 36.6% |
| Mix highlights | HPC 68% of revenue (57% a year ago); 7nm and below 79% | Record 800G shipments; 1.6T in volume production; OCS shipments doubled QoQ; pump lasers sold out |
| Guidance | 4Q revenue US$52.3–54.3bn; 2026 USD revenue +~44%; capex US$60–64bn unchanged | Next-quarter revenue US$1.225–1.275bn, OPM 39.5%–40.5%; CPO demand raised |
Source: TSMC 3Q26 results; Lumentum 4Q FY26 results and earnings call; uSMART Research.
TSMC: CEO C.C. Wei says AI demand is "extremely strong, with no signs of slowing," and far exceeds capacity. Q3 revenue and profit hit records, Q4 guidance implies ~14% QoQ growth at the midpoint, and management suggested AI accelerator revenue growth may exceed its mid-to-high 50s% 2024–2029 CAGR target. As the only scaled supplier of leading-edge nodes and advanced packaging, TSMC has the strongest pricing power and earnings visibility in the chain.
Lumentum: Optical interconnect is a key bottleneck in scaling AI clusters. Revenue doubled within a year, with FY26 revenue of US$3.01bn (+83.2%). EML laser chips set new records, with 200G EML above 25% of EML revenue. Management expects EML and CW laser demand to keep growing into 2027, with 1.6T modules and ultra-high-power CPO lasers driving the next leg of growth.
Opportunity 2: HK internet leaders offer solid fundamentals at low valuations
The Hang Seng TECH Index has corrected since its 6,715 peak on 2 October 2025 and is still down more than 25% in 2026; by end-September its P/E had fallen to about the 10th historical percentile. Southbound investors had bought a net ~HK$379.6bn year to date as of 20 July, and Guosen Securities expects RMB strength in Q4 to improve foreign flows into Hong Kong. Two index heavyweights illustrate the point:
| Metric | Alibaba (9988.HK) | Tencent (0700.HK) |
|---|---|---|
| Latest quarter | 1Q FY27 (Apr–Jun 2026) | 2Q26 (Apr–Jun 2026) |
| Revenue | RMB268.95bn, +9% YoY | RMB204.79bn, +11% YoY |
| Core businesses | AI cloud and compute revenue RMB48.44bn, +45% YoY, fastest in 22 quarters; AI product revenue RMB12.38bn, triple-digit growth for 12 straight quarters | Domestic games +17%, marketing services +22%, FinTech and business services +9%; cloud lifted by AI demand |
| Profit and cash flow | Cloud adjusted EBITA +133% YoY; group net profit RMB10.54bn, -76% YoY; FCF -RMB44.67bn (capex RMB67.7bn) | Adjusted net profit RMB68.42bn, +9% YoY; gross profit +13%; solid earnings quality |
| Valuation | ~13.5x forward P/E, nearly half its January 2026 peak of 25.3x; Jefferies target implies ~79% upside | ~13x 2026E non-IFRS P/E (Guohai Securities, mid-August basis), ~12.6x 2027E |
Source: Alibaba and Tencent financial results, Xinhua, TIKR, Guohai Securities, uSMART Research.
Alibaba: Current profit pressure reflects deliberate investment in AI infrastructure and instant commerce, not operational deterioration. AI cloud has entered a phase of high revenue growth with margin expansion, with adjusted EBITA margin rising to 12%; instant commerce revenue grew 45% and 88VIP members reached ~64 million. At ~13.5x forward P/E, the AI value of its cloud business is not fully priced, and earnings leverage should be significant once the investment phase peaks.
Tencent: Games and advertising remain robust, and AI is already monetising in ad targeting (AIM+), productivity (WorkBuddy) and coding (CodeBuddy), while compute purchases have risen sharply. With earnings growing at a high-single to low-double digit pace, ~13x P/E sits in the lower part of its historical range, offering a solid margin of safety.
Conclusions and recommendations
Conclusion 1: rate pressure has peaked; valuations return to earnings. The 10-year yield formed a cyclical top in early October; our base case is a 5.0%–5.4% range. The hiking path is largely priced and the FOMC itself should add limited shock.
Conclusion 2: the AI cycle remains strong; corrections offer better entry points. Core leaders such as TSMC and Lumentum show rapid revenue growth and rising guidance; this pullback is de-rating, not a cyclical peak.
Conclusion 3: HK internet leaders are at the start of a recovery. Alibaba and Tencent trade at ~13x forward P/E as AI monetisation builds; peaking UST yields and a firmer RMB should drive a re-rating.
| Theme | Representative names | Core thesis | Recommendation |
|---|---|---|---|
| AI supply chain | TSMC, Lumentum | Tight supply in leading-edge nodes and optics; results and guidance rising | Accumulate on weakness; medium-term overweight |
| HK internet leaders | Alibaba, Tencent | Historically low valuations; AI cloud and ad monetisation; solid cash flow | Build positions gradually; hold for re-rating |
| Avoid | Leveraged GPU-rental names | High funding costs, rising refinancing risk | Underweight or avoid |
On timing, we favour scaling in and adding on confirmation: keep flexibility before the FOMC, and accelerate buying if the 10-year stabilises below 5.2% or hyperscaler Q3 results maintain or raise capex guidance.
Investment risks
Renewed rise in yields: If core inflation keeps broadening or oil makes new highs, the 10-year could move toward 5.5%–6.0%, renewing pressure on equity valuations.
AI capex shortfall: If major hyperscalers cut capex guidance or AI monetisation lags, valuations and earnings expectations across the chain could be revised down together.
Credit spillover and geopolitics: Refinancing stress at leveraged AI infrastructure firms could spread through the supply chain; Middle East developments, US midterm outcomes, intensifying platform competition and longer investment cycles in Hong Kong could also weigh on markets.
Risk disclosure
Important Notice: This report is prepared by uSMART Group (the "Company"). uSMART Group's three wholly owned subsidiaries, uSMART Securities Limited, uSMART Securities (Singapore) Pte. Ltd. and uSMART CAPITAL, LLC, are committed to providing clients with safe and reliable securities trading services. uSMART Securities Limited holds Type 1, 2, 4, 5, 6 and 9 licences granted by the Hong Kong Securities and Futures Commission (CE No.: BJA907); uSMART Securities (Singapore) Pte. Ltd. holds a Capital Markets Services (CMS) licence issued by the Monetary Authority of Singapore (Licence No.: CMS101161); uSMART CAPITAL, LLC is registered with the US Securities and Exchange Commission (SEC No.: 8-71200) and is a member of the Financial Industry Regulatory Authority (FINRA) (CRD No.: 329365). This report is based on information obtained from lawful, reliable and publicly available sources, but the Company makes no guarantee as to its accuracy or completeness. The analysis and opinions herein are based on various assumptions, and different assumptions may lead to materially different results. The data, tools, opinions and projections in this report are for reference only and do not constitute an offer to buy or sell any security. Under no circumstances does the information or any opinion expressed herein constitute investment advice to any person. The information, opinions and forecasts reflect the Company's judgement as of the date of publication only. Prices, values and income of the securities or investment targets referred to may fluctuate. The Company may from time to time issue research reports inconsistent with the information, opinions and forecasts herein. Except for liabilities that cannot be excluded by law or regulation, the Company and its employees accept no liability for any direct or indirect loss arising from the use of this report or its contents. The Company or its affiliates may hold and trade positions in securities issued by the companies mentioned herein and may provide, or seek to provide, investment banking services to them. Clients should be aware that the Company may have conflicts of interest that could affect the objectivity of this report. The copyright of this report belongs to uSMART Group. All rights reserved. No institution or individual may reproduce, copy, quote or redistribute this report in any form without written permission, and the Company reserves the right to pursue legal action at any time.
Analyst Certification: Each analyst responsible for this report holds a Type 4 licence (advising on securities) granted by the Hong Kong Securities and Futures Commission. The analysts hereby certify that they have exercised due diligence and maintained objectivity and independence throughout the preparation of this report, which clearly and accurately reflects their own research views. The analysts have not received, do not receive and will not receive any compensation directly or indirectly related to the specific recommendations or views contained in this report.
About the author | uSMART Research
uSMART Research is the analyst team of uSMART Group, focusing on macro strategy, industry cycles and investment opportunities in Hong Kong and US stocks. The analysts who wrote this report each hold a Type 4 licence (advising on securities) granted by the Hong Kong Securities and Futures Commission, and their research views are objective and independent.