國防軍工異動拉昇,工業母機ETF、機牀ETF、軍工ETF上升
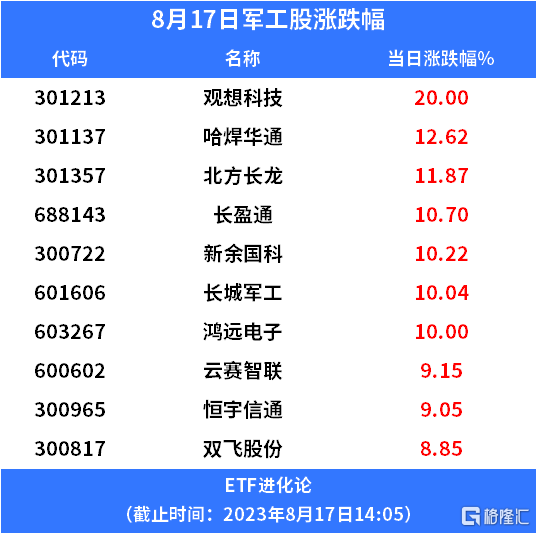
格隆匯8月17日丨國防軍工板塊異動拉昇,觀想科技20cm升停,鴻遠電子、長城軍工升停,哈焊華通、北方長龍等跟升。
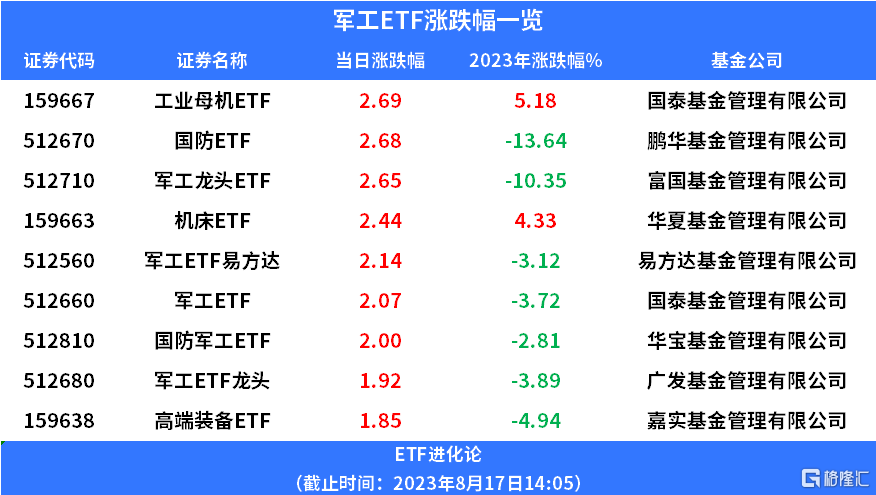
ETF方面,國泰基金工業母機ETF、鵬華基金國防ETF、富國基金軍工龍頭ETF、華夏基金機牀ETF、軍工ETF易方達 、國泰基金軍工ETF 、華寶基金國防軍工ETF升超2%,廣發基金軍工ETF龍頭、嘉實基金高端裝備ETF跟升。
中信建投研報表示,在已披露半年度業績上市公司中,船舶板塊表現亮眼,中國船舶、中國重工、亞星錨鏈等產業鏈內上市公司淨利潤增速較快,主要源於上半年航運回暖,船東購船意願持續走高,船價上行,民品業務實現高速增長。部分細分賽道例如新域新質方向增速亦十分明顯,無人機、隱身材料、核相關、3D打印等新興方向業績得到階段性兑現。部分主流裝備產業鏈相對下游上市公司,在經歷短時間業績壓力後,業績出現回暖跡象。目前,桎梏軍工板塊估值上行最主要的訂單下放因素依舊存在,但影響訂單下放各項改革已在逐步推進過程中。後續軍用裝備各品類訂單下放大趨勢確定,需求側實質回暖有望切實恢復軍工較高景氣度。
根據中國船舶協會數據顯示,2023年1-7月,中國造船完工量2409萬載重噸,同比增長15.6%;新接訂單量4476萬載重噸,同比增長74%;手持訂單量12790萬載重噸,同比增長23.4%,分別佔世界市場份額的47.8%、67.7%和52.9%,保持領先位置。2023年1-7月,我國新接訂單中,散貨船、油船、集裝箱船、氣體船分別佔比42%、31%、15%和6%,散貨船佔比有所提高;完工訂單中分別佔比52%、11%、30%和2%,集裝箱船完工量佔比持續提升。產業集中度方面,造船完工量前十家集中度66.1%,新接訂單量前十家集中度64.4%,行業持續向龍頭集中趨勢明顯。2023年7月,我國新船訂單量398萬載重噸,佔全球份額40.9%;韓國新船訂單量389萬載重噸,佔比40%;日本新船訂單量185萬載重噸,佔比19%。7月全球成交新船訂單100艘合計973萬載重噸,其中集裝箱船佔比最高,按載重噸計,佔比接近7月全部訂單的50%。
中國已經正式超過長期霸佔榜單的希臘,成為全球最大的船東國。中國船東所持有的船隊規模達到2.492億總噸(GT),市場份額佔比15.9%(中國船東的船隊價值約為1800億美元),高於希臘船東2.490億GT,市場份額佔比15.8%(希臘船東的船隊價值約為1630億美元)。中國船東的船隊規模的領先主要得益於幹散貨和集裝箱船隊的增長。從2015年開始,中國船東擁有的船隊規模增長強勁,尤其是幹散貨船隊和集裝箱船隊的規模增長最為突出。強大的貨運規模、造船業和日益活躍的金融業推動中國船隊規模的快速提升。
安信證券認為,當前軍工行業“十四五”中期調整帶來的相關影響或已基本觸底,產業鏈部分企業業績及市場對其預期亦已至底部區間,當下時點軍工行業或處於拐點前期,應重點關注投資機會,建議關注主機廠、發動機、白馬股及新域新質四條主線。
浙商證券表示,2023年軍工機會大於風險。看好導彈/信息化/航發/軍機子行業,軍機“十四五”有望大幅增長。航發受益“維保+換髮”、未來空間大。導彈受益於“戰略儲備+耗材屬性”,信息化受益於“信息化程度加深+國產替代”,增速更高。
Follow us
Find us on
Facebook,
Twitter ,
Instagram, and
YouTube or frequent updates on all things investing.Have a financial topic you would like to discuss? Head over to the
uSMART Community to share your thoughts and insights about the market! Click the picture below to download and explore uSMART app!

Disclaimers
uSmart Securities Limited (“uSmart”) is based on its internal research and public third party information in preparation of this article. Although uSmart uses its best endeavours to ensure the content of this article is accurate, uSmart does not guarantee the accuracy, timeliness or completeness of the information of this article and is not responsible for any views/opinions/comments in this article. Opinions, forecasts and estimations reflect uSmart’s assessment as of the date of this article and are subject to change. uSmart has no obligation to notify you or anyone of any such changes. You must make independent analysis and judgment on any matters involved in this article. uSmart and any directors, officers, employees or agents of uSmart will not be liable for any loss or damage suffered by any person in reliance on any representation or omission in the content of this article. The content of the article is for reference only and does not constitute any offer, solicitation, recommendation, opinion or guarantee of any securities, virtual assets, financial products or instruments. Regulatory authorities may restrict the trading of virtual asset-related ETFs to only investors who meet specified requirements. Any calculations or images in the article are for illustrative purposes only.
Investment involves risks and the value and income from securities may rise or fall. Past performance is not indicative of future performance. Please carefully consider your personal risk tolerance, and consult independent professional advice if necessary.


