科創50指數進入技術性牛市?科創50ETF今年以來升超16%
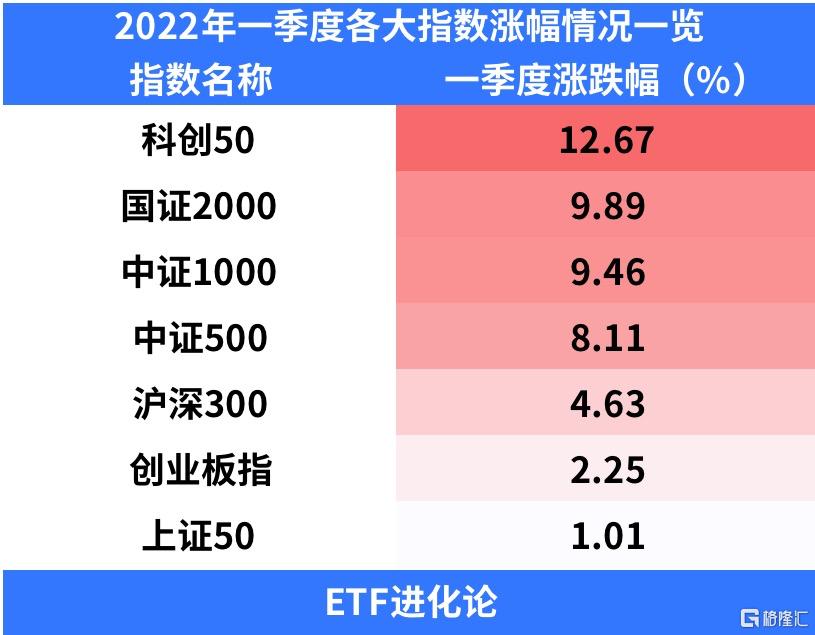
近期,科創50指數出現逼空式大升,一季度累計升幅高達12.67%,位居A股各大寬基指數之首。
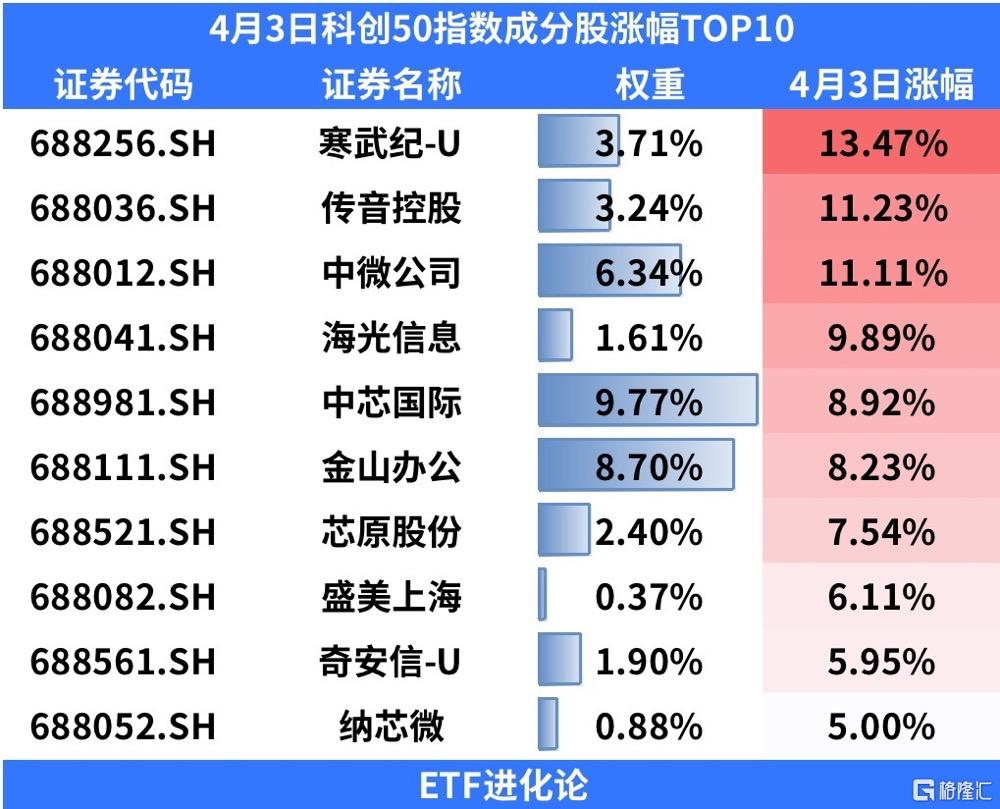
昨日,由於TMT板塊的大幅拉昇,科創50指數更是單日暴升4.16%,其中多隻成分股升幅驚人。
而外資和機構早已借道ETF佈局科創50指數。隨着基金2022年年報披露完畢,ETF前十大持有人全貌浮出水面。
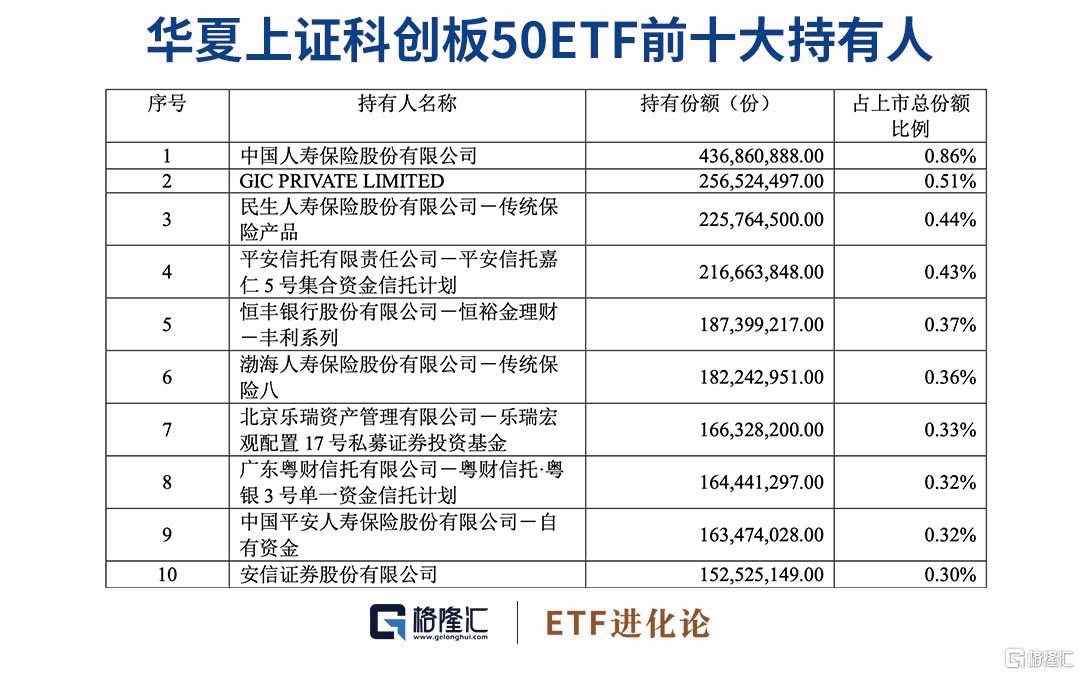
2022年,華夏上證科創板50ETF份額淨增長365.49億份,位居全市場第一。基金年報顯示,截至2022年底,華夏上證科創板50ETF前十大持有人均為機構投資者。
其中,第一大持有人中國人壽保險股份有限公司持有份額為4.37億份,佔該ETF上市總份額比重為0.86%,持有份額較2022年6月底增長近2億份。
此外,新加坡政府投資有限公司也大舉買入華夏上證科創板50成份ETF,併成為新進前十大持有人,持有份額為2.57億份。知名私募機構樂瑞資產持有份額超過1.5億份。
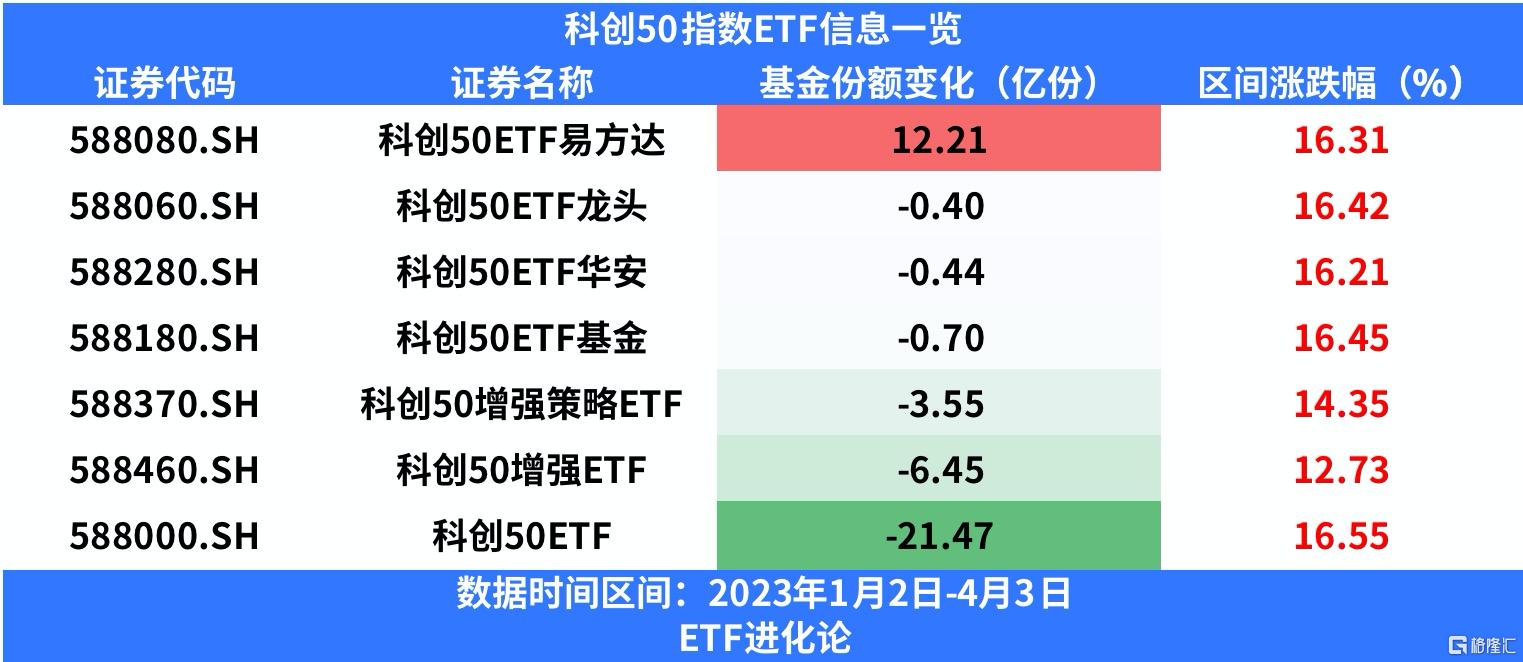
值得注意的是,隨着今年科創50指數的持續上升,資金卻不斷撤退。截止至4月3日,去年份額大增的華夏上證科創板50ETF,其基金份額今年以來累計減少21.47億份。
與此同時,科創50指數ETF中,規模排名第二的易方達上證科創板50ETF(211.60億),其基金份額今年以來卻累計增加12.21億份。
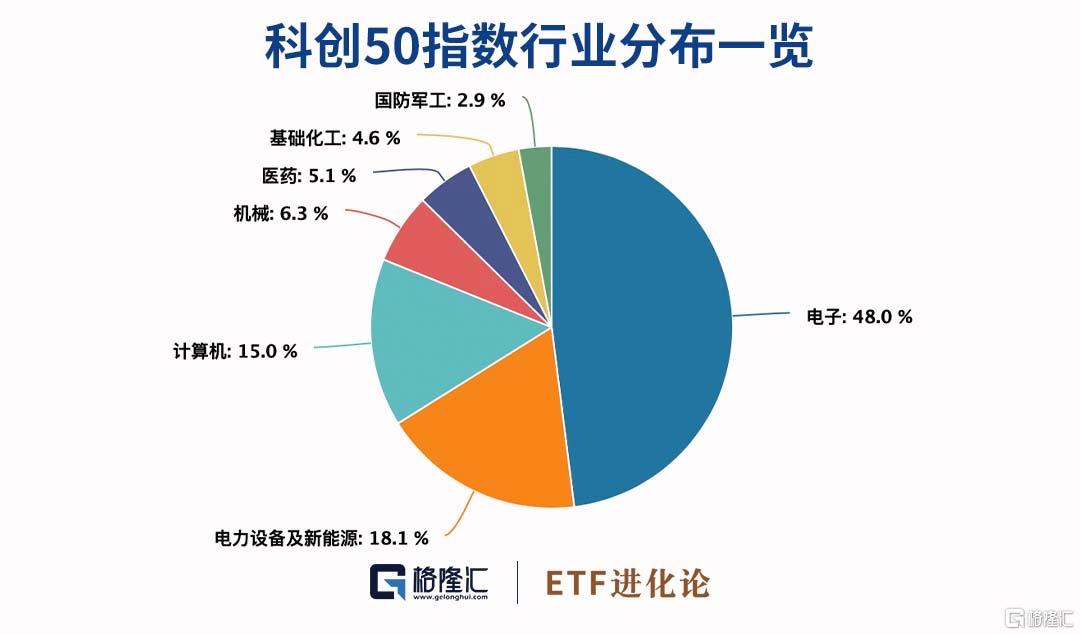
科創50指數今年表現如此亮眼,主要歸功於指數的成分股多為電子和計算機行業相關企業。根據指數行業分佈,電子和計算機行業合計佔比高達63%。
從行情層面來看,科創板和2012年創業板經歷類似,先後經歷了“估值調整期”和“市場磨底期”。從交易層面來看,2022年底科創板與2012年底創業板相比,存在3點相似:回調幅度(40%以上)、估值水平(5%PE分位數)、換手率(歷史低位)。
財通證券首席策略分析師李美岑分析認為,後續科創板能否也進入類似2013年創業板行情,核心驅動因素有三點。
政策支持。2012年7月“十二五”戰略性新興產業規劃推出七大產業發展路線圖,而當前“十四五”規劃綱要頂層支持科創自主可控,科創板也已放開再融資與減持。第二,資金流入。科創板的基金重倉佔比2.8%,已高於2012年創業板(從2012年的1.6%上升至13年的4.2%)。第三,業績拐點。2013年創業板恰逢移動互聯網和併購潮興起,關注一季度科創業績。
李美岑認為,結合市場預期來看,科創的業績拐點和行情或已在路上。科創板2022年各季度相對營收增速分別為15%、15%、22%、37%,相對盈利增速6%、-1%、16%、20%,2022年預期業績增速向上佐證拐點已過。展望2023年,整體看,未來營收和盈利增速走勢仍可能上修。結構上看,2022年預期電新板塊營收增速超2021年、2023年,剔除電新後科創板2023年預期營收增速向上,科創板中結構機會仍然較大。
財通證券認為,投資者需要重視科創板,經歷去年一季度和四季度的疫情擾動後,科創板公司“一身輕鬆”,定增減持等資本市場政策放鬆,業績低基數+外延併購放開,可能會出現大量150億以內的中小市值公司演繹後續三個季度業績環比改善的成長故事,這是科創板中最強的beta和alpha.具體到行業層面,數字經濟關注運營商、GPT-4、半導體設備材料、傳媒等方向。
國金證券認為,TMT為代表的科技成長將是超額收益核心主線。TMT可能已經具備新主線的所有重要特徵。具體來説,“基本面見底回升、機構配置低位”是必要條件,“產業趨勢新變化”是充分條件。類比移動互聯網浪潮的產業趨勢,2016年的AlphaGo類比2007年的初代iPhone,技術和產品出現拐點式的變化;當前AIGC類比2010年的iPhone4,技術和產品開始不斷普及;未來1-2年或呈現2013年移動互聯網應用的大爆發。
Follow us
Find us on
Facebook,
Twitter ,
Instagram, and
YouTube or frequent updates on all things investing.Have a financial topic you would like to discuss? Head over to the
uSMART Community to share your thoughts and insights about the market! Click the picture below to download and explore uSMART app!

Disclaimers
uSmart Securities Limited (“uSmart”) is based on its internal research and public third party information in preparation of this article. Although uSmart uses its best endeavours to ensure the content of this article is accurate, uSmart does not guarantee the accuracy, timeliness or completeness of the information of this article and is not responsible for any views/opinions/comments in this article. Opinions, forecasts and estimations reflect uSmart’s assessment as of the date of this article and are subject to change. uSmart has no obligation to notify you or anyone of any such changes. You must make independent analysis and judgment on any matters involved in this article. uSmart and any directors, officers, employees or agents of uSmart will not be liable for any loss or damage suffered by any person in reliance on any representation or omission in the content of this article. The content of the article is for reference only and does not constitute any offer, solicitation, recommendation, opinion or guarantee of any securities, virtual assets, financial products or instruments. Regulatory authorities may restrict the trading of virtual asset-related ETFs to only investors who meet specified requirements. Any calculations or images in the article are for illustrative purposes only.
Investment involves risks and the value and income from securities may rise or fall. Past performance is not indicative of future performance. Please carefully consider your personal risk tolerance, and consult independent professional advice if necessary.


