潤陽股份創業板上會在即,產品結構單一,資產負債率高達80%
據瞭解,江蘇潤陽新能源科技股份有限公司(以下簡稱:潤陽股份)將於11月3日上會,擬登陸創業板,海通證券為其保薦機構。
本次衝刺IPO,公司擬募資40億元,其中20億元用於“年產5萬噸高純多晶硅項目”、5億元用於“年產5GW異質結電池片生產項目”、15億元用於“補充流動資金項目”。
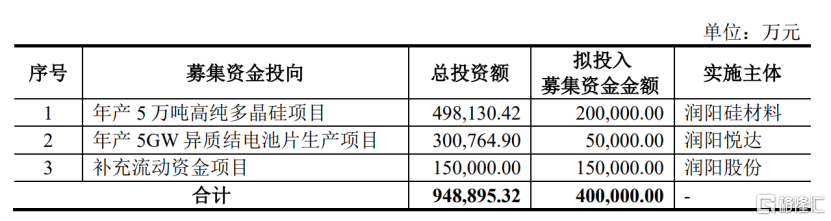
(募集資金用途,招股書)
潤陽股份是一家光伏企業,主要產品為單晶PERC太陽能電池片,主要銷售給大型知名組件廠商,並最終運用於光伏發電系統,是決定發電系統性能的核心部件。
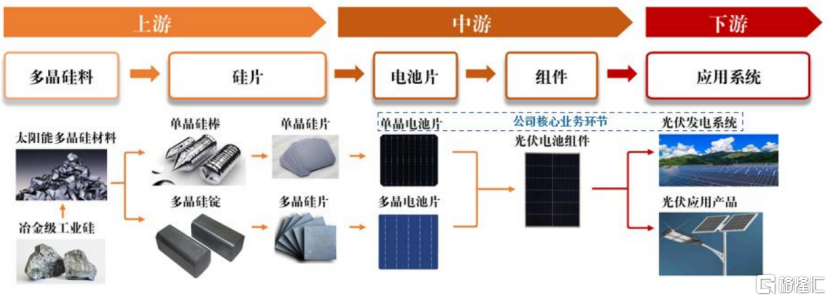
(公司在產業鏈中所處位置,來源:招股書)
目前,公司單晶PERC電池片產能達到22GW3,具備182mm及以上大尺寸電池片的生產能力,公司將於2023年上半年建成13GW TOPCon電池生產線,並擬實施5GW異質結電池募投項目;此外,公司正在寧夏建設年產5萬噸高純多晶硅項目,並積極申報寧夏GW級光伏電站建設指標、現已獲批140MW保障性併網規模。
根據PV InfoLink統計,2020年、2021年和2022年上半年公司太陽能電池片銷量均位居全球第三名。
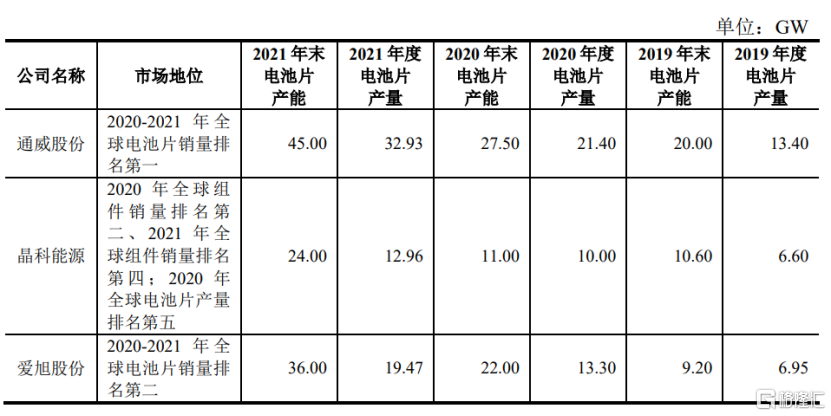
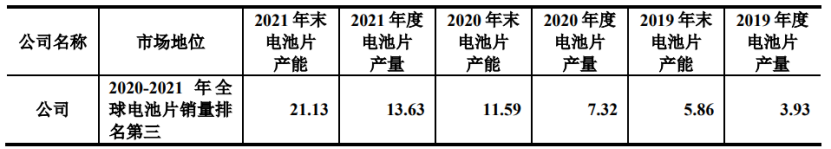
(主要競爭者情況,招股書)
2019年至2022年1-6月,潤陽股份的營業收入分別為30.26億元、47.98億元、106.17億元和89.77億元,相應的歸母淨利潤分別為2.43億元、5.13億元、4.86億元和5.06億元,可以發現公司的營收增長較快,但利潤出現較大的波動,2021年出現增收不增利的情況。
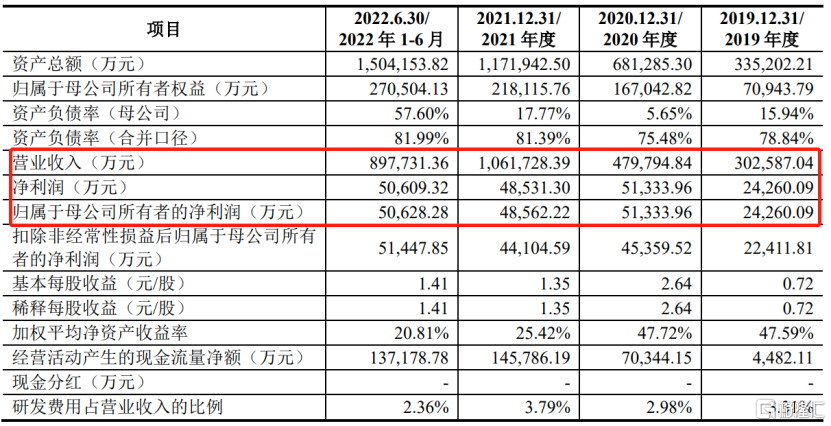
(主要財務指標,招股書)
潤陽股份的主要業務集中於電池片環節,產品結構較為單一,抗風險能力相對不足。報吿期內,公司太陽能電池片業務收入分別為 29.94億元、47.13億元、104.54億元和88.98億元,佔同期主營業務收入的比例分別為99.52%、99.15%、99.34%和99.57%。
報吿期內,公司主營業務毛利率分別為16.65%、19.54%、10.90%和12.56%,存在一定的波動,整體略高於可比公司平均水平。
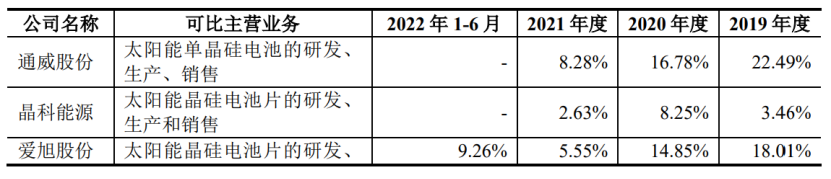
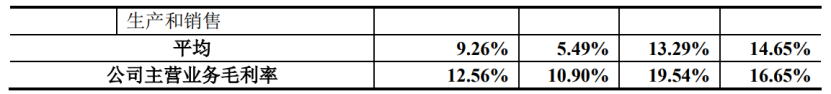
(主營業務毛利率與可比公司的對比情況,招股書)
報吿期各期末,公司資產負債率分別為78.84%、75.48%、81.39%和81.99%,流動比率和速動比率均不足1倍,與同行業可比上市公司相比,公司資產負債率相對較高,流動比率和速動比率相對較低。
為擴大先進產能、延伸產業鏈及搶佔海外市場,公司大幅增加資本性支出規模,新建項目對資金的需求較大,且公司主要通過債務融資方式補充資金投入缺口。如果未來下游市場波動導致公司收入增速放緩,原材料價格上漲使公司經營成本增加,或新建項目盈利水平不及預期,公司的短期支付能力將面臨較大壓力,存在償債及流動性風險。
Follow us
Find us on
Facebook,
Twitter ,
Instagram, and
YouTube or frequent updates on all things investing.Have a financial topic you would like to discuss? Head over to the
uSMART Community to share your thoughts and insights about the market! Click the picture below to download and explore uSMART app!

Disclaimers
uSmart Securities Limited (“uSmart”) is based on its internal research and public third party information in preparation of this article. Although uSmart uses its best endeavours to ensure the content of this article is accurate, uSmart does not guarantee the accuracy, timeliness or completeness of the information of this article and is not responsible for any views/opinions/comments in this article. Opinions, forecasts and estimations reflect uSmart’s assessment as of the date of this article and are subject to change. uSmart has no obligation to notify you or anyone of any such changes. You must make independent analysis and judgment on any matters involved in this article. uSmart and any directors, officers, employees or agents of uSmart will not be liable for any loss or damage suffered by any person in reliance on any representation or omission in the content of this article. The content of the article is for reference only and does not constitute any offer, solicitation, recommendation, opinion or guarantee of any securities, virtual assets, financial products or instruments. Regulatory authorities may restrict the trading of virtual asset-related ETFs to only investors who meet specified requirements. Any calculations or images in the article are for illustrative purposes only.
Investment involves risks and the value and income from securities may rise or fall. Past performance is not indicative of future performance. Please carefully consider your personal risk tolerance, and consult independent professional advice if necessary.


