美股多頭重燃鬥志? 期權市場驚現8000萬巨單押注美股上行!
智通財經APP獲悉,根據投資機構Piper Sandler提供的統計數據,在美股週一的一筆交易中,有投資者耗資約8,000萬美元購買看漲期權,押注標普500指數將在12月前上行至4,300點。上週五美股出現了一連串的買盤交易,導致芝加哥期權交易所(CBOE)股票看跌/看漲期權統計比率創下7月以來最大跌幅。
有分析人士認爲,包括那些被美股近期反彈所吸引的“較謹慎”投資者也紛紛涌向期權市場,並且將其作爲一種快速追趕市場的方式。
市場對看漲期權的偏好與8月底的情況截然相反,當時美股連續三週暴跌促使交易員紛紛買入看跌期權對衝。儘管懷疑論者警告稱,這一反彈只是一次空頭擠壓,但它確實刺激了一些投資者,尤其是那些在未來幾個月就要提交年度收益率的機構投資者。
近期美股看漲情緒回暖
Susquehanna Financial Group策略師Christopher Jacobson在一份報告中寫道:“有幾個例子表明,投資者轉向看漲敞口,爲進一步上行做好準備,包括直接邁入看漲行列和賣出看跌期權。”“它們肯定可能是由那些減持投資者所推動,這些投資者希望看到上漲行情,以限制他們的風險敞口。”

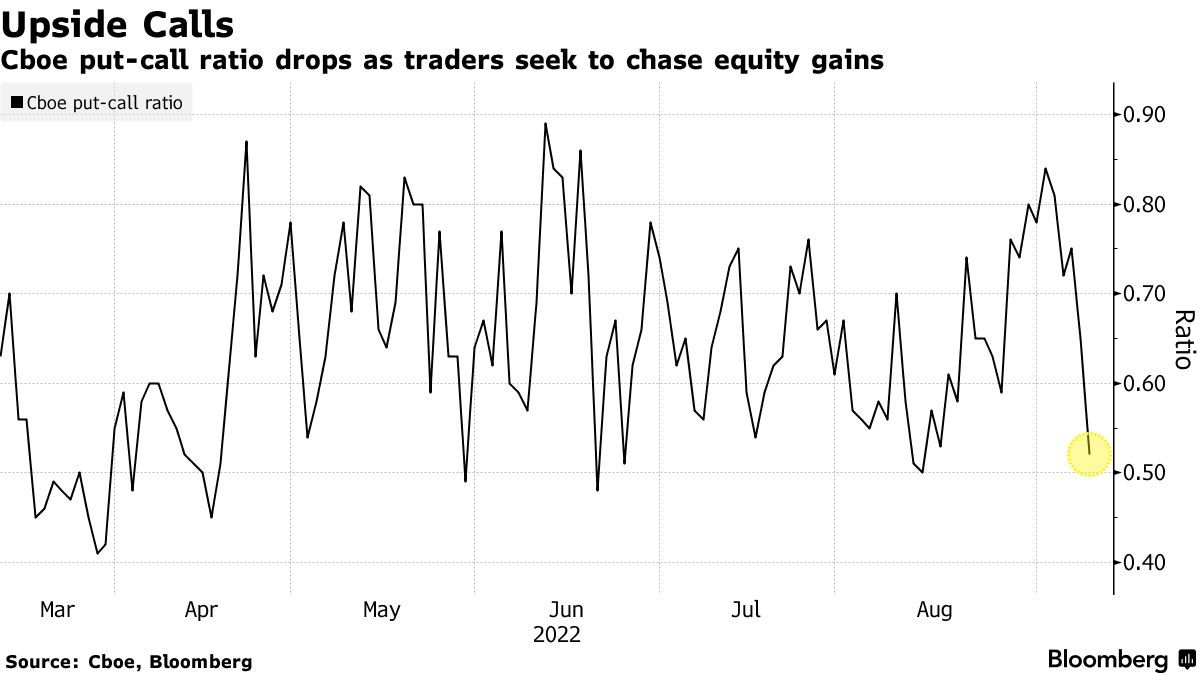
交易員尋求追逐股票收益之際,芝加哥期權交易所看跌/看漲期權比率下降
在Susquehanna聚焦的上週五看漲期權市場中,有一筆以每份53美分的價格買入了3萬份看漲期權,押注iShares 羅素2000 ETF(IWM.US)在月底前將漲至199美元。如果該ETF在到期前上漲6.6%,這筆押注就能實現盈虧平衡。另一項交易涉及支付約2.65美元購買約15,000份與SPDR標普生物科技ETF(XBI.US)掛鉤的看漲期權,行權價格爲100美元,11月到期。Christopher Jacobson指出,如果該基金未來兩個月的漲幅超過16%,這筆交易就會賺取收益。
儘管在任何一個交易日總有交易員買入看漲期權或賣出看跌期權,但芝加哥期權交易所的總體數據顯示,市場明顯轉向看漲立場。股票看漲/看跌期權比率在上週五降至0.52,低於本月初的高點0.84。
“FOMO”捲土重來?
在日內短線交易員和專業短線投機者對美股感到失望之後,擔心錯失良機的情緒(FOMO)突然又開始在美股盛行。儘管由於通脹加劇、地緣政治動盪以及美聯儲政策立場強硬等因素,市場風險偏好仍然低迷,但追逐美股上漲的衝動情緒正在擡頭。
高盛集團追蹤的對衝基金在截至上週四的一週內,該公司跟蹤的對衝基金一個月來首次大量買入股票,該公司統計的主要經紀公司數據顯示,名義多頭買盤達到一年期以來的高點。
週一,隨着美股連續第四個交易日實現上漲,投資機構Piper Sandler的期權交易主管Danny Kirsch注意到,在週一美股最初的反彈期間,出現了一筆規模相當大的衍生品交易。一名交易員以每份90美元的價格買入大概9,000份12月到期的標普500指數看漲期權,期權行權點位爲4,300點。他預測,如果到期時該指數收於4,390點以上,這筆交易將有利可圖。該基準美股指數週一收於4,110.41點。
“它的規模很大,”Kirsch表示。“但也許是有人投資不足,或者只是單純看多,希望利用年底之前的漲勢。”
Follow us
Find us on
Facebook,
Twitter ,
Instagram, and
YouTube or frequent updates on all things investing.Have a financial topic you would like to discuss? Head over to the
uSMART Community to share your thoughts and insights about the market! Click the picture below to download and explore uSMART app!

Disclaimers
uSmart Securities Limited (“uSmart”) is based on its internal research and public third party information in preparation of this article. Although uSmart uses its best endeavours to ensure the content of this article is accurate, uSmart does not guarantee the accuracy, timeliness or completeness of the information of this article and is not responsible for any views/opinions/comments in this article. Opinions, forecasts and estimations reflect uSmart’s assessment as of the date of this article and are subject to change. uSmart has no obligation to notify you or anyone of any such changes. You must make independent analysis and judgment on any matters involved in this article. uSmart and any directors, officers, employees or agents of uSmart will not be liable for any loss or damage suffered by any person in reliance on any representation or omission in the content of this article. The content of the article is for reference only and does not constitute any offer, solicitation, recommendation, opinion or guarantee of any securities, virtual assets, financial products or instruments. Regulatory authorities may restrict the trading of virtual asset-related ETFs to only investors who meet specified requirements. Any calculations or images in the article are for illustrative purposes only.
Investment involves risks and the value and income from securities may rise or fall. Past performance is not indicative of future performance. Please carefully consider your personal risk tolerance, and consult independent professional advice if necessary.


