PMI再度回落,債牛未盡
本文來自格隆匯專欄:中金研究,作者: 李劉陽、張文朗
事件
中國7月官方製造業PMI為49,預期50.4,前值50.2。7月官方非製造業PMI為53.8,預期53.8,前值54.7。
評論
7月製造業PMI從上月的50.2降至49,其中生產和新訂單降幅較大,考慮PMI衡量的是經濟活動環比意義變化,而7月製造業PMI明顯低於疫情前今年2月的50.2,這表明製造業經營活動環比仍在下行,並且離疫情前水平仍有一定距離;7月部分省市有疫情爆發,不過疫情對製造業影響相對有限,結合中觀行業表現,尤其是房地產市場下行,7月製造業PMI下行主要反映下行需求不足;此外,6-7月商品價格大幅下行,這會對中間商和下游補庫產生抑制,也不利於需求釋放和生產活動。7月非製造業商務活動指數從54.7降至53.8,部分省市疫情對服務業有所拖累,不過商務活動指數仍然明顯高於疫情前2月水平,非製造業總體仍在恢復之中。
當前國內經濟的關鍵仍在於房地產,尤其是房地產企業資金情況,從政治局會議定調來看,政策強調保交樓和穩民生,這意味着前期停工項目可能得到政策支持,後續房屋竣工可能加快。不過,由於商品房銷售仍然低迷,房地產企業資金壓力難以得到根本緩解,土地出讓到新屋開工可能難以明顯回升,隨着竣工增加而存量施工面積下降,房地產投資下行壓力仍然較大。從政治局會議定調來看,今年年內貨幣政策有望維持寬鬆,資金利率有望維持低位。今年前7月長端利率持續震盪,主要在於市場擔心疫情後經濟大幅反彈,目前來看經濟反彈力度明顯低於投資者預期,我們認為長端利率需要進行重新定價,需要有一個補降過程,今年年內長端利率有望迎來一波下行,我們建議投資者關注相應交易機會。
7月製造業PMI從6月的50.2回落至49,重新降回收縮區間,所有分項全部回落,經濟動能指標從6月的1.8回落至0.5,顯示經濟仍處於弱復甦局面。供給側來看,生產分項自52.8回落至49.8,原材料價格自52大幅回落至40.4,7月以來大宗商品價格進一步回落,以黑色系為代表的商品在盈利壓縮顯著和需求不足的情況下減產明顯,對生產端造成一定拖累;需求側方面,新訂單、新出口訂單均明顯回落,分別回落1.9和2.1個百分點至48.5和47.4,內需在經濟弱復甦、房地產仍形成拖累的情況下仍較為疲弱,外需則在全球流動性收緊,海外經濟體經濟預期回落帶動下趨弱;庫存方面,原材料庫存和產成品庫存相比上月分別回落0.2和0.6個百分點至47.9和48,原材料庫存回落主要受7月部分行業有所減產降價帶動,產成品庫存回落幅度小於5、6月則指向需求不足,後續需繼續觀察原材料庫存和產成品庫存同時回落情況是否持續。
7月非製造業商務活動指數從上月的54.7降至53.8,7月部分省市爆發較集中疫情,加上製造業有所放緩,非製造業復甦步伐有所放緩,考慮PMI調查衡量的是環比意義變化,7月商務活動指數仍然明顯高於今年2月疫情前水平,這表明非製造業總體仍在繼續修復;其中建築業商務活動指數從56.6升至59.2,由於資金壓力較大,房地產項目施工仍然緩慢,不過基建項目施工好於季節性,建築活動有所改善;服務業商務活動指數從54.3降至52.8,各地疫情使得服務業修復放緩,不過總體仍在復甦之中。從非製造業其他分項來看,新訂單指數從53.2降至49.7,需求反彈有所放緩;投入品價格從52.6降至48.6,銷售價格從49.6降至47.4,隨着商品價格下跌,加上需求有所走弱,服務價格也明顯調整;從業人員從46.9降至46.7,非製造業就業低位再次回落;業務活動預期指數從61.3降至59.1,市場主體預期有所走弱。
風險
經濟下行超預期。
圖表1:經濟動能指標(新訂單-產成品庫存)
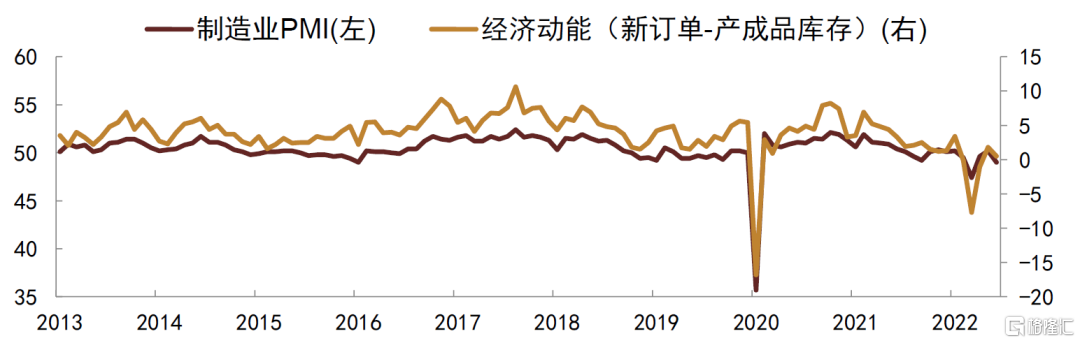
資料來源:Wind,中金公司研究部(數據截止至2022年7月)
圖表2:PMI原材料價格分項與PPI
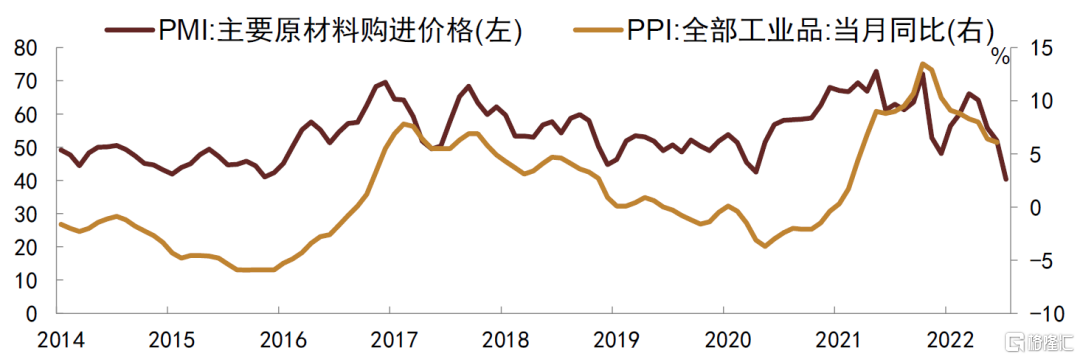
資料來源:Wind,中金公司研究部(數據截止至2022年7月)
圖表3:非製造業PMI
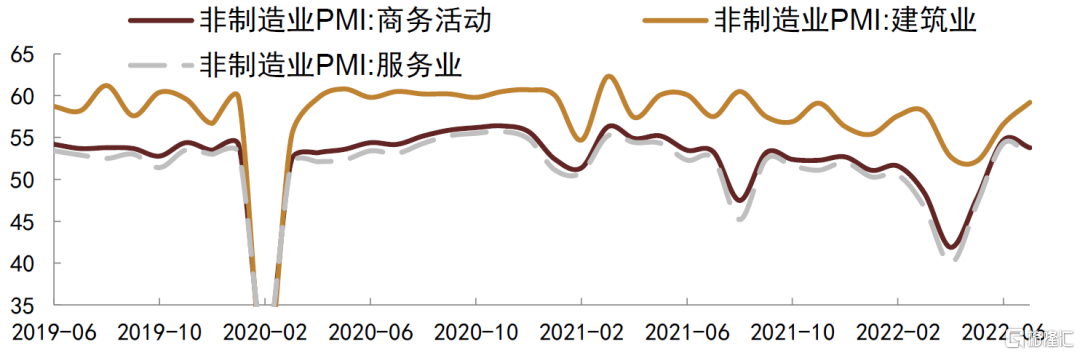
資料來源:Wind,中金公司研究部(數據截止至2022年7月)
Follow us
Find us on
Facebook,
Twitter ,
Instagram, and
YouTube or frequent updates on all things investing.Have a financial topic you would like to discuss? Head over to the
uSMART Community to share your thoughts and insights about the market! Click the picture below to download and explore uSMART app!

Disclaimers
uSmart Securities Limited (“uSmart”) is based on its internal research and public third party information in preparation of this article. Although uSmart uses its best endeavours to ensure the content of this article is accurate, uSmart does not guarantee the accuracy, timeliness or completeness of the information of this article and is not responsible for any views/opinions/comments in this article. Opinions, forecasts and estimations reflect uSmart’s assessment as of the date of this article and are subject to change. uSmart has no obligation to notify you or anyone of any such changes. You must make independent analysis and judgment on any matters involved in this article. uSmart and any directors, officers, employees or agents of uSmart will not be liable for any loss or damage suffered by any person in reliance on any representation or omission in the content of this article. The content of the article is for reference only and does not constitute any offer, solicitation, recommendation, opinion or guarantee of any securities, virtual assets, financial products or instruments. Regulatory authorities may restrict the trading of virtual asset-related ETFs to only investors who meet specified requirements. Any calculations or images in the article are for illustrative purposes only.
Investment involves risks and the value and income from securities may rise or fall. Past performance is not indicative of future performance. Please carefully consider your personal risk tolerance, and consult independent professional advice if necessary.


