浙商策略:各類基金對恆生科技的配置情況
本文來自:王楊策略研究 ,作者:王楊 陳昊
1. 2022Q1公募基金重倉持股恆生科技情況
我們認為,以平台經濟為代表的恆生科技迎來估值底、政策底、盈利底共振,恆生科技迎來轉折底,進入戰略配置窗口。
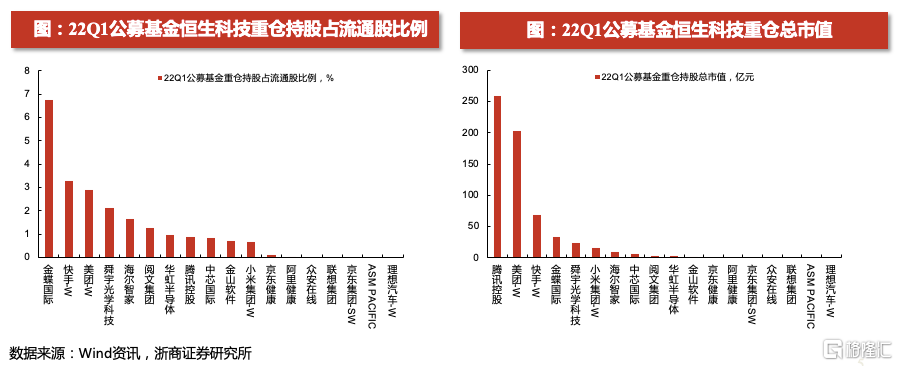
本期報吿,我們重點分析2022年一季報重倉持股恆生科技指數成分的公募基金有哪些。其中,我們統計的公募基金口徑為被動指數、指數增強、普通股票、偏股混合、靈活配置、平衡混合和偏債混合這幾類基金,分析的數據為2022年一季度基金的重倉股持倉。以基金22Q1重倉持股港股科技總市值為排序標準。
整體來看,2022年Q1公募基金重倉持股的18家公司分別為:騰訊控股、美團、快手、金蝶國際、舜宇光學科技、小米集團、海爾智家、中芯國際、閲文集團、華虹半導體、金山軟件、京東健康、阿里健康、京東集團、眾安在線、聯想集團、ASM PACIFIC、理想汽車。
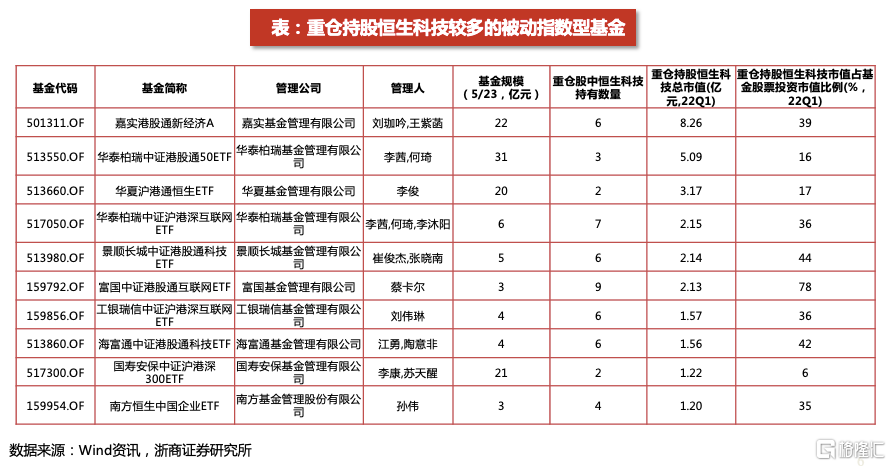
2. 重倉恆生科技較多的被動指數型基金
被動指數型基金中,2022Q1重倉股中恆生科技持股市值較高的前十大基金分別為嘉實港股通新經濟A、華泰柏瑞中證港股通50ETF、華夏滬港通恆生ETF、華泰柏瑞中證滬港深互聯網ETF、景順長城中證港股通科技ETF、富國中證港股通互聯網ETF、工銀瑞信中證滬港深互聯網ETF、海富通中證港股通科技ETF、國壽安保中證滬港深300ETF、南方恆生中國企業ETF。
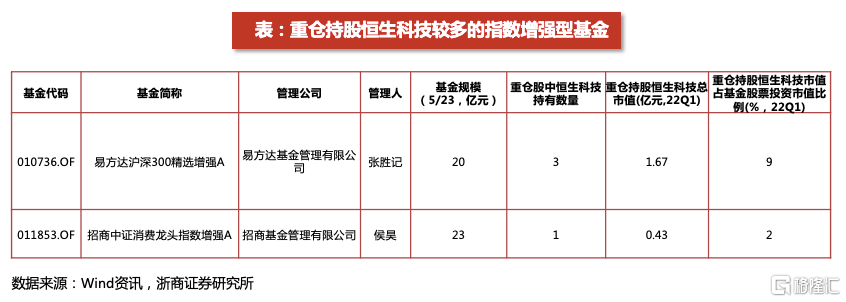
3. 重倉恆生科技較多的指數增強型基金
指數增強型基金中,2022Q1重倉股中有恆生科技持股的基金分別為易方達滬深300精選增強A、招商中證消費龍頭指數增強A。
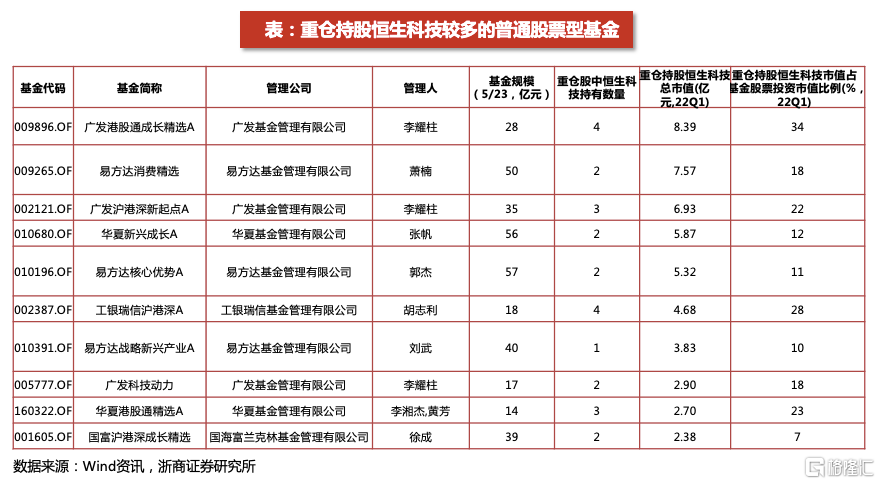
4. 重倉恆生科技較多的普通股票型基金
普通股票型基金中,2022Q1重倉股中恆生科技持股市值較高的前十大基金分別為廣發港股通成長精選A、易方達消費精選、廣發滬港深新起點A、華夏新興成長A、易方達核心優勢A、工銀瑞信滬港深A、易方達戰略新興產業A、廣發科技動力、華夏港股通精選A、國富滬港深成長精選。
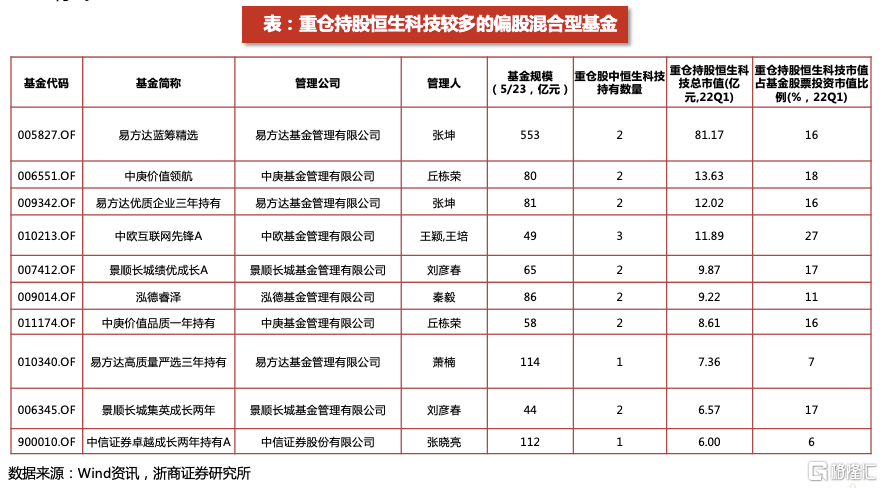
5. 重倉恆生科技較多的偏股混合型基金
偏股混合型基金中,2022Q1重倉股中恆生科技持股市值較高的前十大基金分別為易方達藍籌精選、中庚價值領航、易方達優質企業三年持有、中歐互聯網先鋒A、景順長城績優成長A、泓德睿澤、中庚價值品質一年持有、易方達高質量嚴選三年持有、景順長城集英成長兩年、中信證券卓越成長兩年持有A。
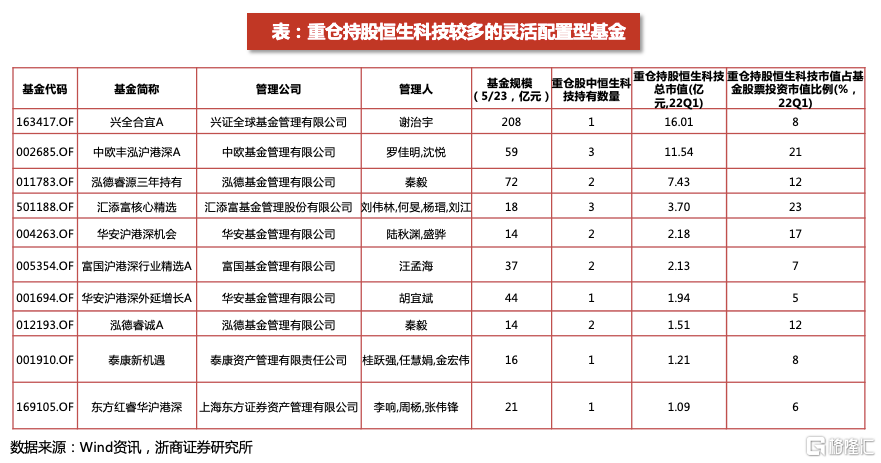
6. 重倉恆生科技較多的靈活配置型基金
靈活配置型基金中,2022Q1重倉股中恆生科技持股市值較高的前十大基金分別為興全合宜A、中歐豐泓滬港深A、泓德睿源三年持有、匯添富核心精選、華安滬港深機會、富國滬港深行業精選A、華安滬港深外延增長A、泓德睿誠A、泰康新機遇、東方紅睿華滬港深。
摘要
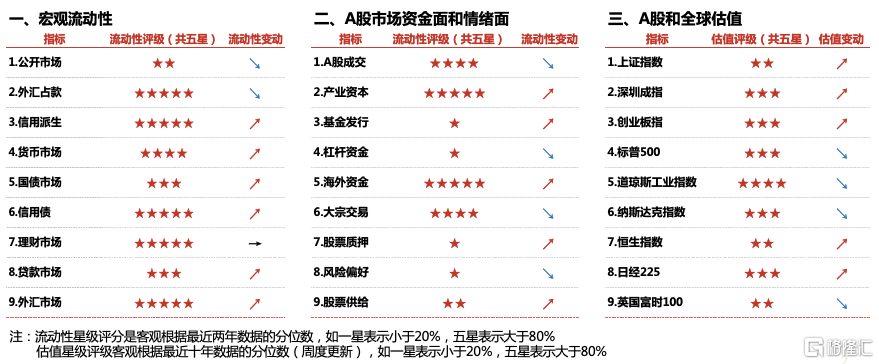
宏觀流動性:
1. 上週逆回購淨回籠100億,MLF沒有操作;
2. 市場利率方面,DR007小幅上升至1.58%,R007小幅上升至1.69%;
3. 美元兑人民幣小幅下降至6.75;
4. 理財產品預期收益率(3個月)維持在1.92%。
5. 十年期國債收益率維持在2.82%;
A股市場資金面和情緒面:
1. 上週A股成交額下降,換手率下降;
2. 兩融餘額維持在1.52萬億;
3. 北上資金大幅淨流入152.2億元;
4. 上週A股小幅淨減持、回購規模下降,本週限售解禁規模下降;
5. 風格來看,上週中盤股、高PE、中價股、微利股表現最好。
A股和全球估值:
A股和全球估值:從PB-ROE的角度來看,上週估值水平遠低於盈利能力的行業分別為銀行、煤炭、石油石化、建築裝飾、鋼鐵、基礎化工、有色金屬、非銀金融、家用電器、紡織服飾。
風險提示
1. 流動性出現較大的波動
2. 歷史估值不具備參考意義
Follow us
Find us on
Facebook,
Twitter ,
Instagram, and
YouTube or frequent updates on all things investing.Have a financial topic you would like to discuss? Head over to the
uSMART Community to share your thoughts and insights about the market! Click the picture below to download and explore uSMART app!

Disclaimers
uSmart Securities Limited (“uSmart”) is based on its internal research and public third party information in preparation of this article. Although uSmart uses its best endeavours to ensure the content of this article is accurate, uSmart does not guarantee the accuracy, timeliness or completeness of the information of this article and is not responsible for any views/opinions/comments in this article. Opinions, forecasts and estimations reflect uSmart’s assessment as of the date of this article and are subject to change. uSmart has no obligation to notify you or anyone of any such changes. You must make independent analysis and judgment on any matters involved in this article. uSmart and any directors, officers, employees or agents of uSmart will not be liable for any loss or damage suffered by any person in reliance on any representation or omission in the content of this article. The content of the article is for reference only and does not constitute any offer, solicitation, recommendation, opinion or guarantee of any securities, virtual assets, financial products or instruments. Regulatory authorities may restrict the trading of virtual asset-related ETFs to only investors who meet specified requirements. Any calculations or images in the article are for illustrative purposes only.
Investment involves risks and the value and income from securities may rise or fall. Past performance is not indicative of future performance. Please carefully consider your personal risk tolerance, and consult independent professional advice if necessary.


