


據格隆匯新股瞭解,近日,寧波恆普真空科技股份有限公司(以下簡稱“恆普科技”)的科創板IPO已獲得受理,方正證券為其保薦機構。
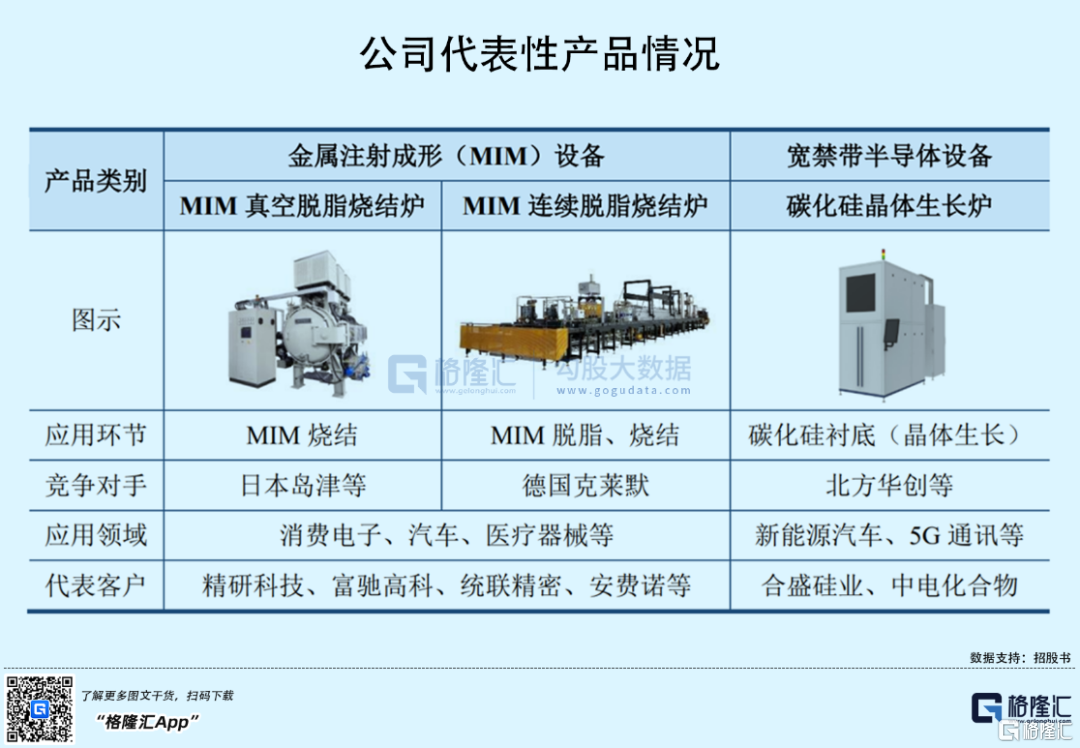
恆普科技是一家以材料研究為基礎、以高温熱場環境控制為技術核心的金屬注射成形(MIM)領域和寬禁帶半導體領域的關鍵設備供應商,主要產品包括金屬注射成形(MIM)脱脂燒結爐、碳化硅晶體生長爐、碳化硅同質外延設備等熱工裝備。
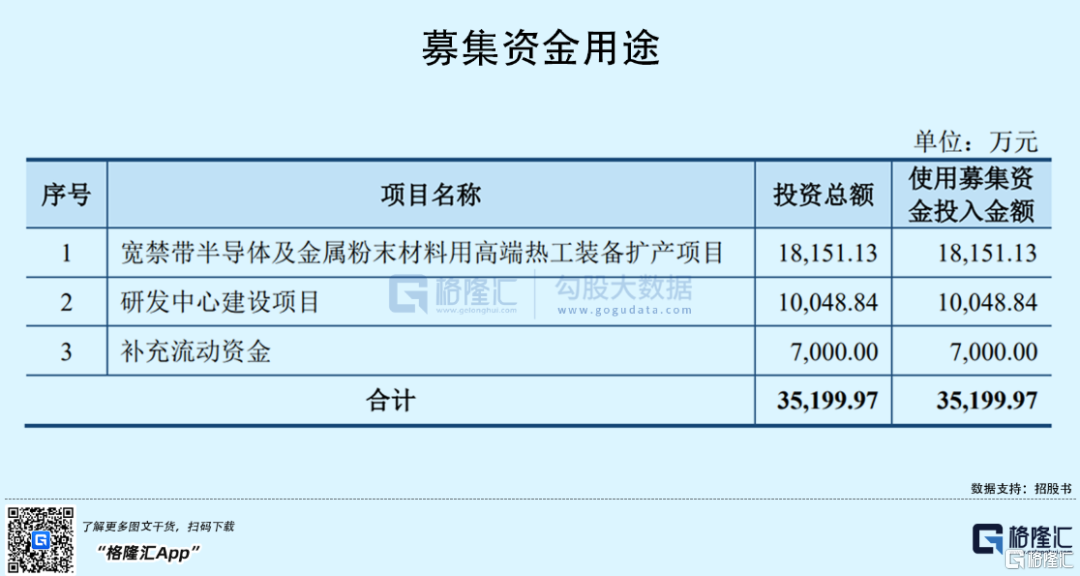
公司本次發行擬募集資金3.52億元,其中,1.82億元用於寬禁帶半導體及金屬粉末材料用高端熱工裝備擴產項目、1.0億元用於研發中心建設項目、7000萬元用於補充流動資金。
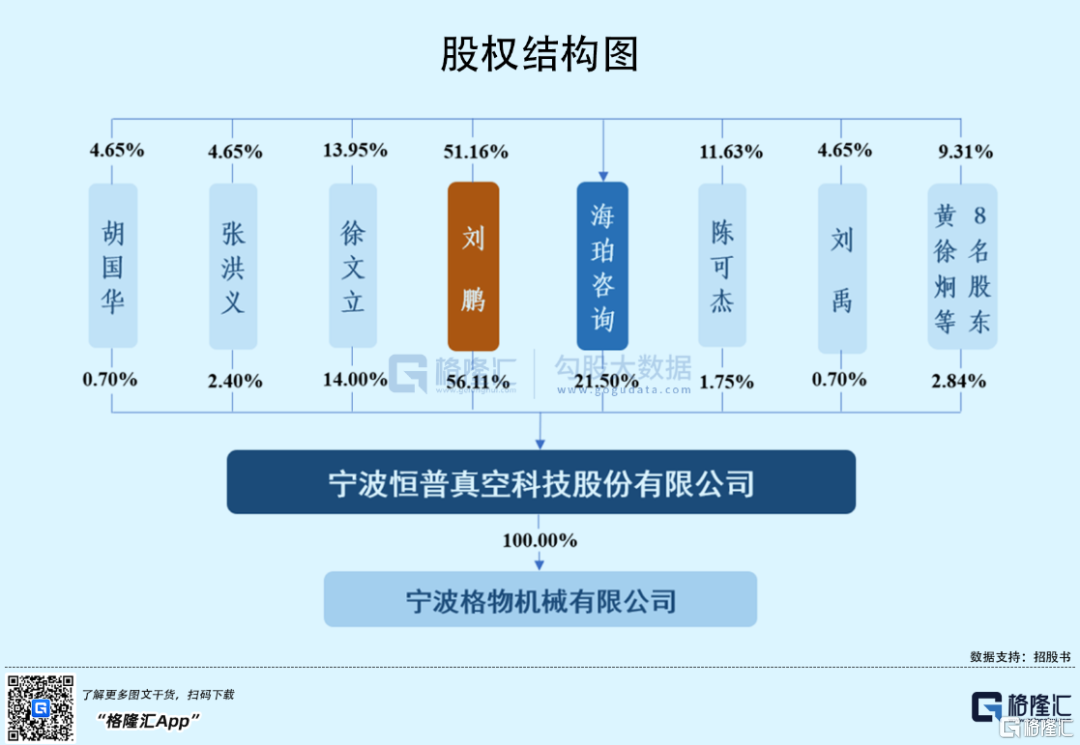
截至發行前,恆普科技的控股股東、實際控制人為劉鵬,其通過直接和間接方式合計控制公司77.61%的股份表決權。
1
產品結構存在單一性
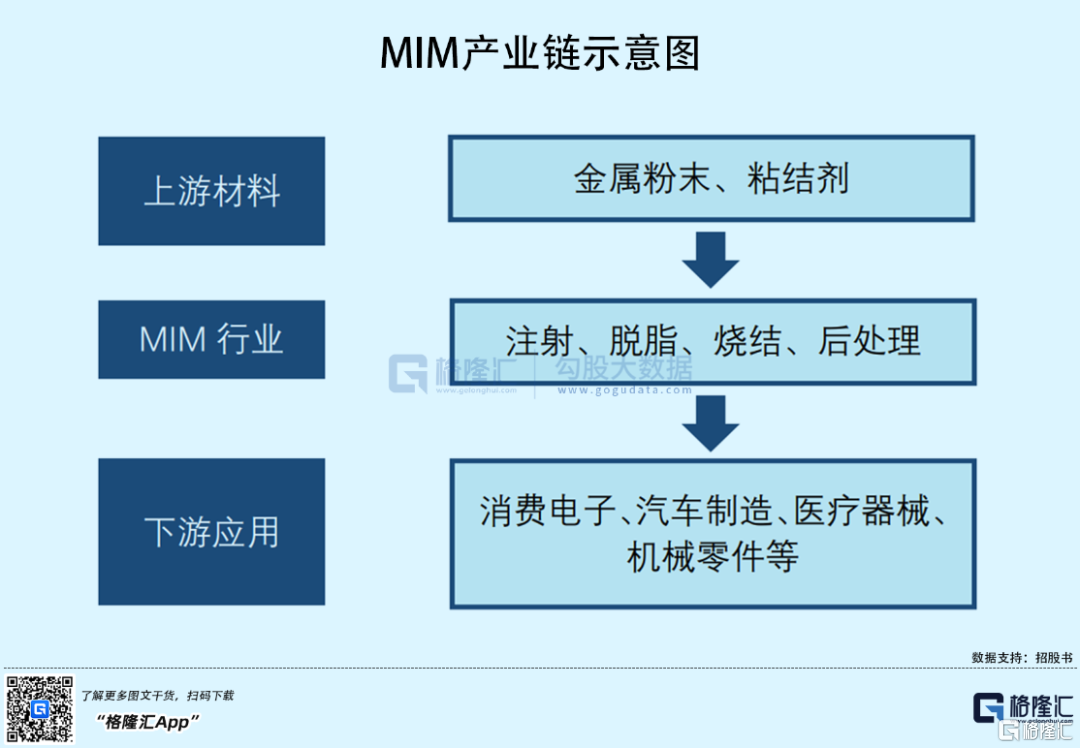
目前在全球範圍內,MIM工藝製備的零部件已經廣泛應用於電子產品、汽車、國防軍工、醫療器械、航空航天、五金等諸多領域。
得益於下游市場的蓬勃發展,全球MIM市場實現了穩健增長。根據中國鋼結構協會粉末冶金分會的統計,全球MIM市場規模從2015年的21.6億美元增長至2019年的29億美元。Maximize Market Research預計,到2026年全球MIM市場規模將增長到69.2 億美元。
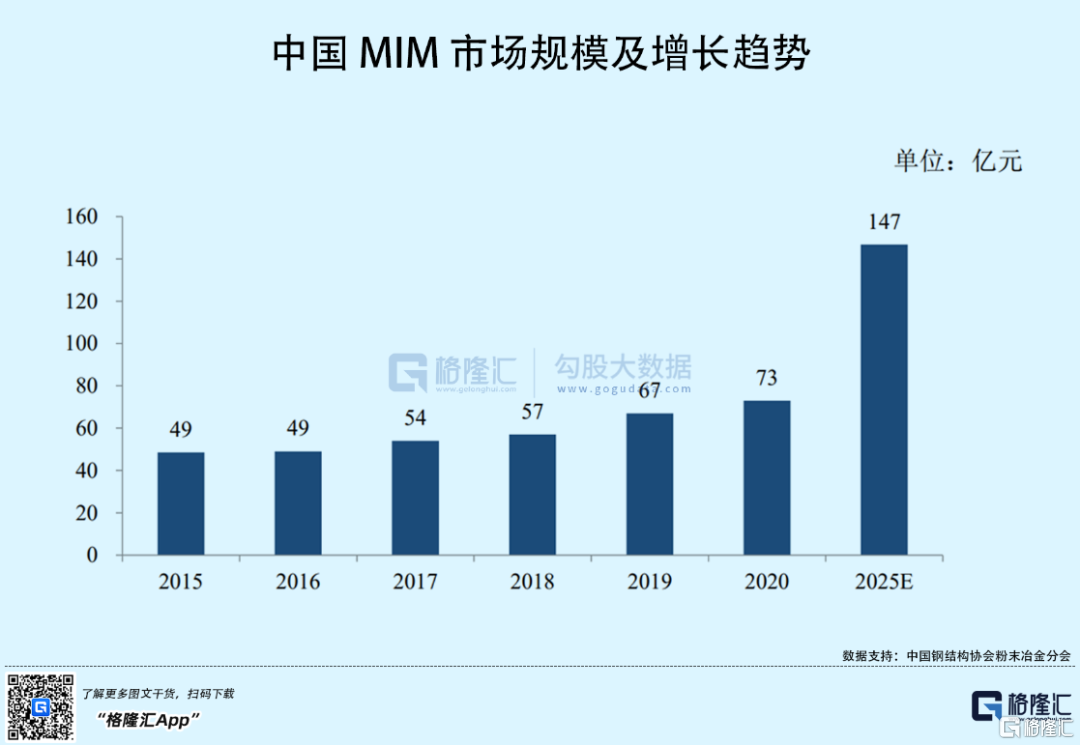
國內 MIM 行業同樣呈現快速發展的趨勢,市場規模從2015 年的48.50 億人民幣增長至2020年的73億人民幣,預計未來5年年複合增長率有望在15%以上。
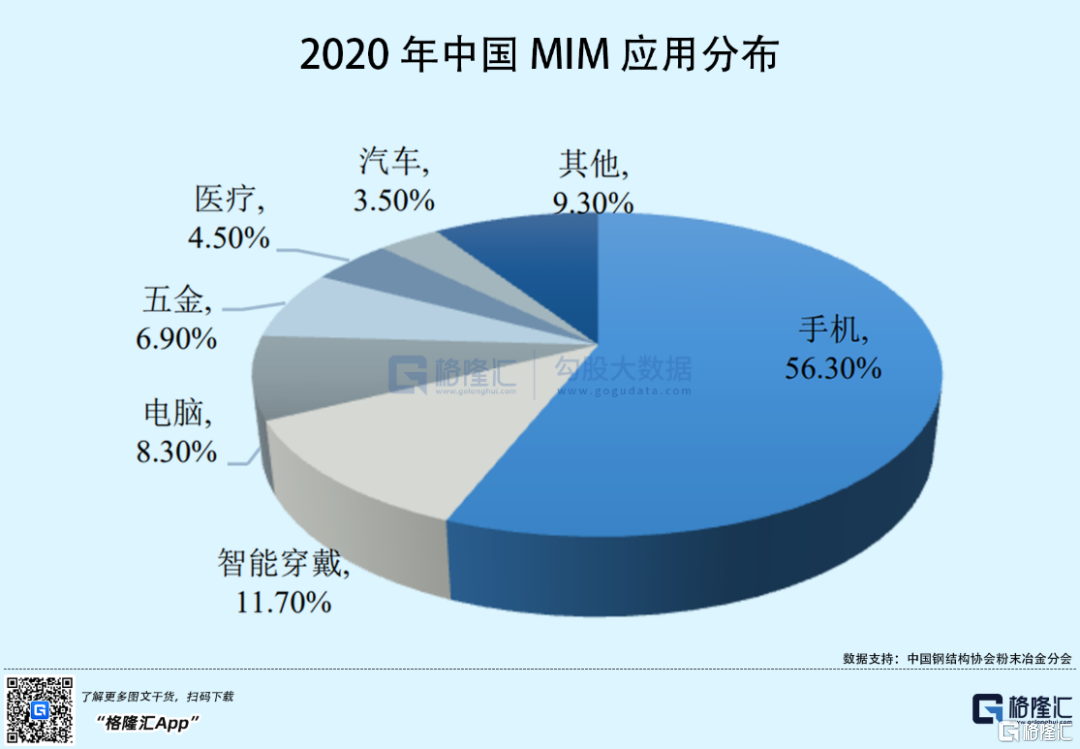
目前我國 MIM 技術的應用主要集中在電子產品領域,其他領域的應用佔比相對較少。其中,2020 年我國 MIM 產品的應用分佈中,手機佔56.3%、智能穿戴佔11.7%、電腦佔8.3%。
根據公開資料顯示,在MIM細分領域真空脱脂燒結爐方面,2013年1月至2014年8月,恆普科技的真空爐市場佔有率就已經超越日本島津,2020年公司的MIM真空脱脂燒結爐產品國內市場佔有率達到79%;MIM步進梁式連續脱脂燒結爐產品國內市場佔有率達到78%,市場優勢較為明顯。
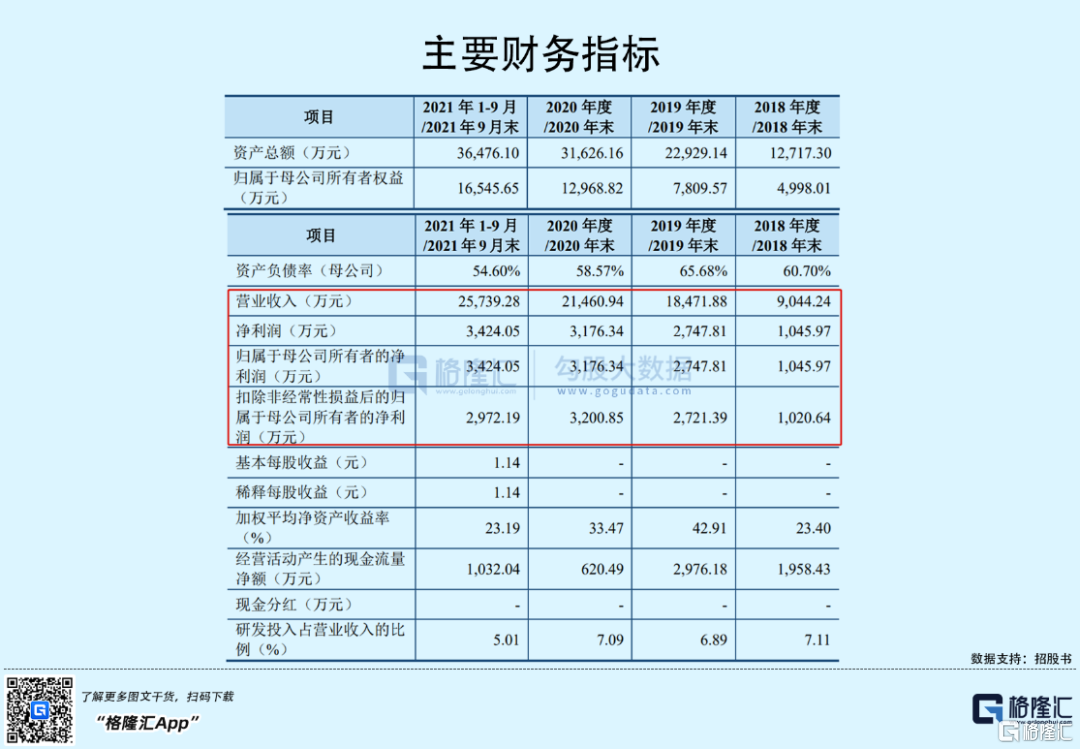
業績方面,2018年至2021年1-9月各報吿期,恆普科技的營收分別為9044.24萬元、1.85億元、2.15億元和2.57億元,歸母淨利潤分別為1045.97萬元、2747.81萬元、3176.34萬元和3424.05萬元,公司營收規模較小,但呈現上升趨勢,業務規模擴張較快。
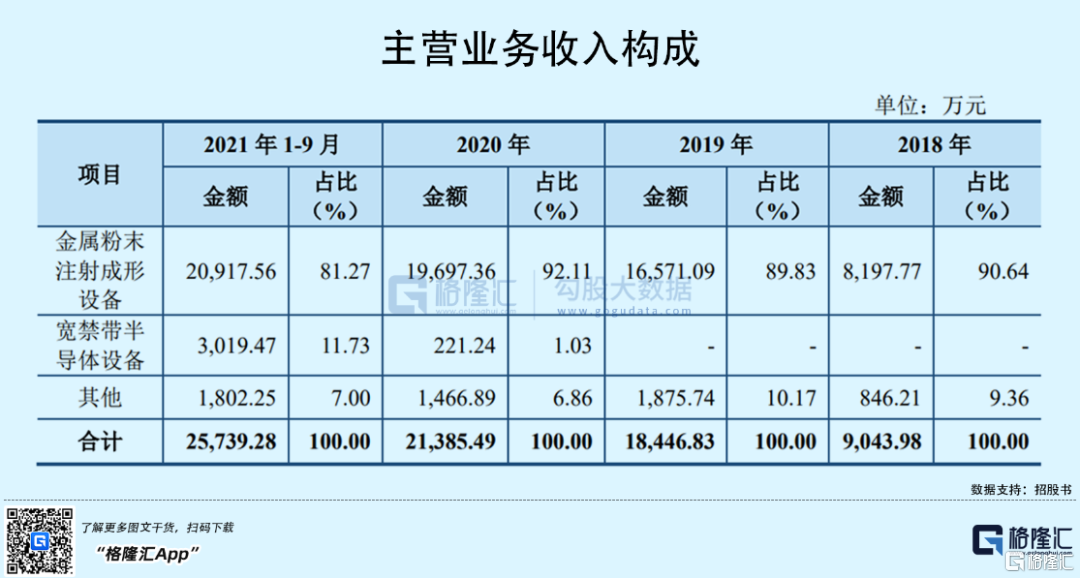
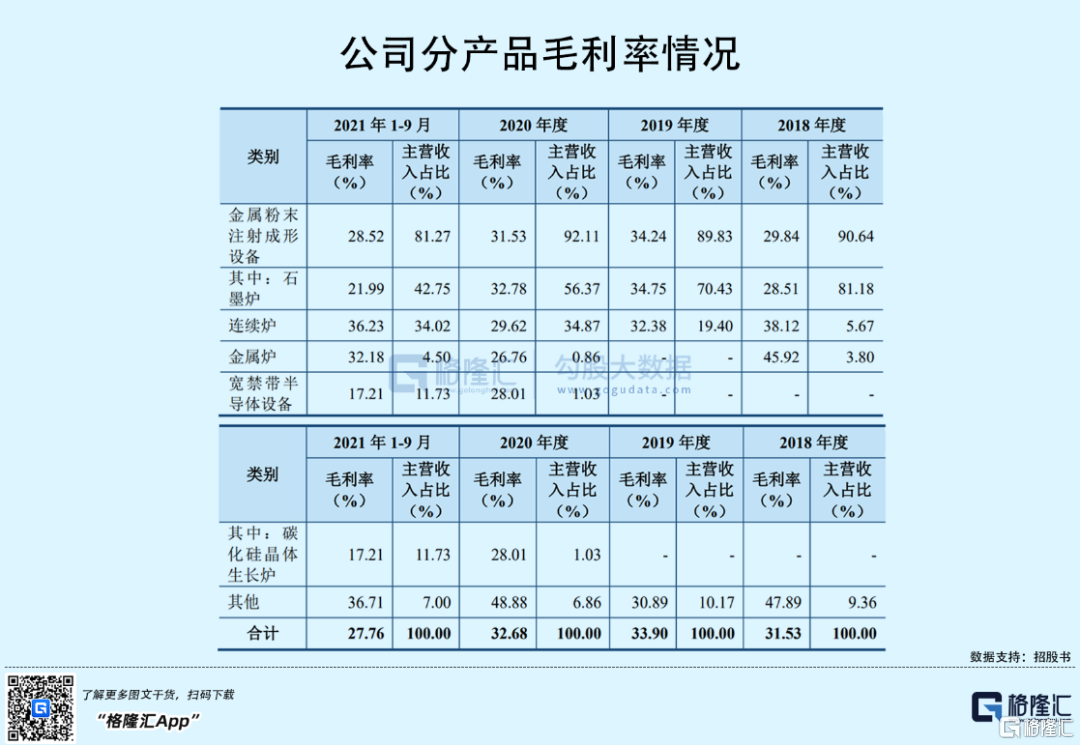
恆普科技目前的主要收入和利潤來源於金屬注射成形(MIM)設備的生產和銷售,公司產品結構相對單一。報吿期內,公司金屬注射成形(MIM)設備收入佔主營業務收入的比例分別為90.64%、89.83%、92.11%和81.27%,而寬禁帶半導體設備自2020年才開始產生收入,佔比較小。
其中,公司在寬禁帶半導體設備領域存在客户集中度較高的風險。報吿期內,公司寬禁帶半導體設備收入主要來自於合盛硅業,2021 年 1-9月,公司對合盛硅業的銷售收入佔寬禁帶半導體設備銷售收入的97.07%。
2
研發費用率持續低於同行
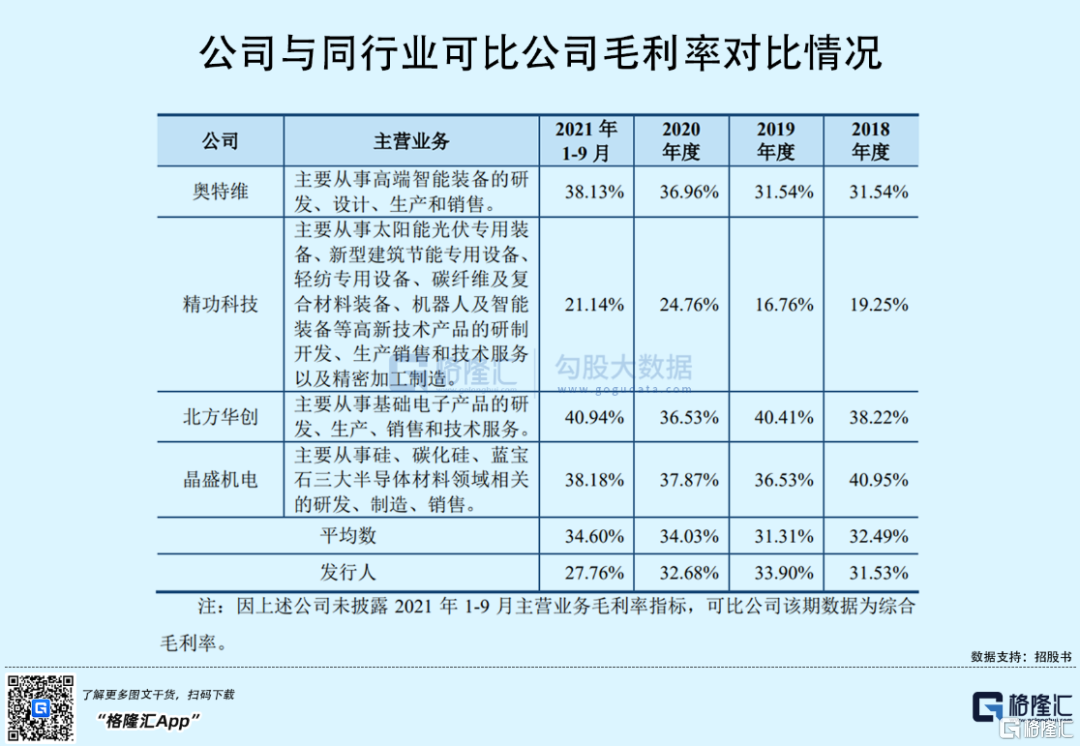
由於MIM設備客户為降低生產成本,要求設備廠商保持設備價格穩定,且隨着競爭對手同類設備的技術水平不斷上升,導致行業內競爭趨於激烈。同時,恆普科技在寬禁帶半導體設備業務上,對產品售價進行了一定的戰略性調控,進而導致其毛利率短期內波動較大。報吿期內,公司主營業務毛利率分別為31.53%、33.90%、32.68%和27.76%,整體呈下降趨勢,且略低於同行業可比公司毛利率平均水平。
從生產模式來看,恆普科技主要根據在手訂單和預計市場需求情況確定原材料採購計劃和生產計劃,日常採取“以銷定產、適當備庫”的生產模式。報吿期各期末,公司存貨賬面價值分別為6190.30萬元、8307.71萬元、1.25億元和1.58億元,佔公司流動資產的比例分別為60.43%、44.38%、47.19%和52.56%,各期末存貨餘額持續增加,未來存在一定的存貨減值風險。
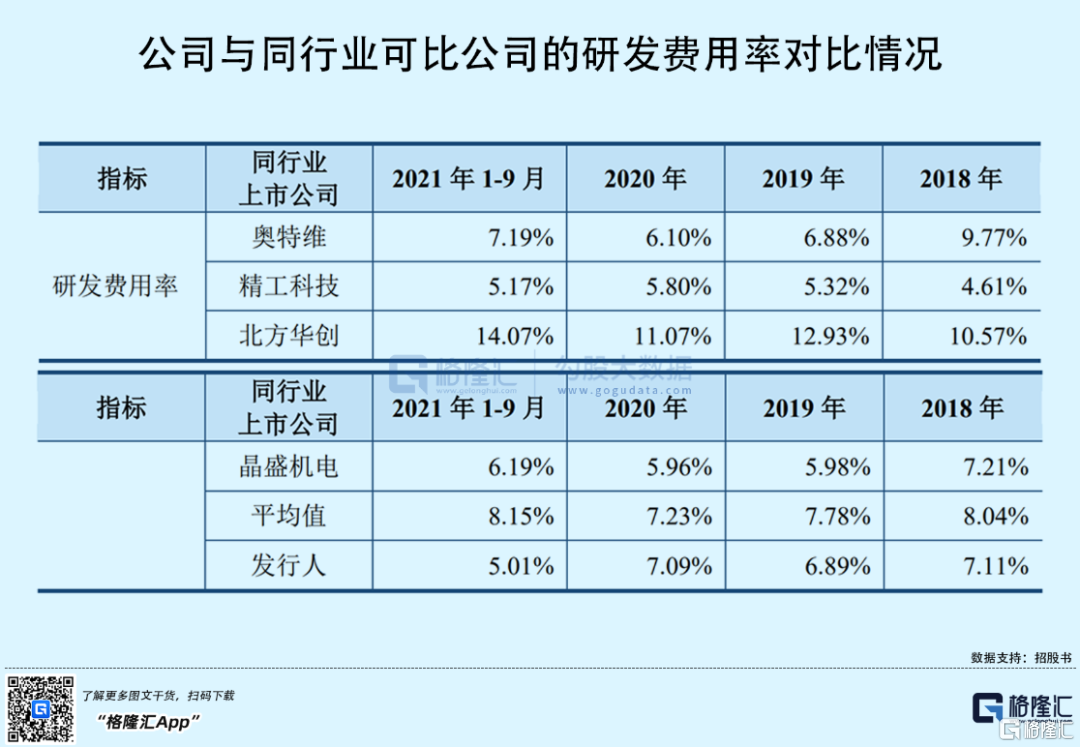
另外值得注意的是,恆普科技的研發費用率略顯弱勢,持續低於可比公司平均水平。報吿期內,公司研發費用分別為643.43萬元、1273.41萬元、1521.18萬元和1289.03萬元,佔營業收入的比例分別為7.11%、6.89%、7.09%和5.01%,而同行業平均水平均在7%以上。
3
結語
整體來看,恆普科技雖然在 MIM 設備細分領域脱脂燒結爐的市場地位具有一定優勢,但目前公司的經營規模較小,且毛利率有下滑的趨勢,同時研發亟待提升。公司未來仍需積極開發寬禁帶半導體領域的新客户,持續加大研發投入、鞏固並提升公司的市場競爭力。


More Content


