弘陽服務(1971.HK):年度業績穩中有進,營收穩增47.2%
2022年3月25日盤後,國內社區綜合服務的深入踐行者——弘陽服務(1971.HK)發佈截至2021年12月31日的年度業績。
財報顯示,2021年,公司實現收入11.3億元人民幣,同比大幅增長47.2%;實現淨利潤1.38億元人民幣,同比增長48.2%;毛利率為28.4%,較2020年同期上升0.5個百分點;股東應占溢利1.3億元人民幣,同比增加42.6%;在外拓方面,公司全委外拓項目在管面積大增478萬平方米至779萬平方米,較去年同期增長159%。
以下是關於公司最新業績的具體要點:
營收利潤雙豐收,財務指標持續優化
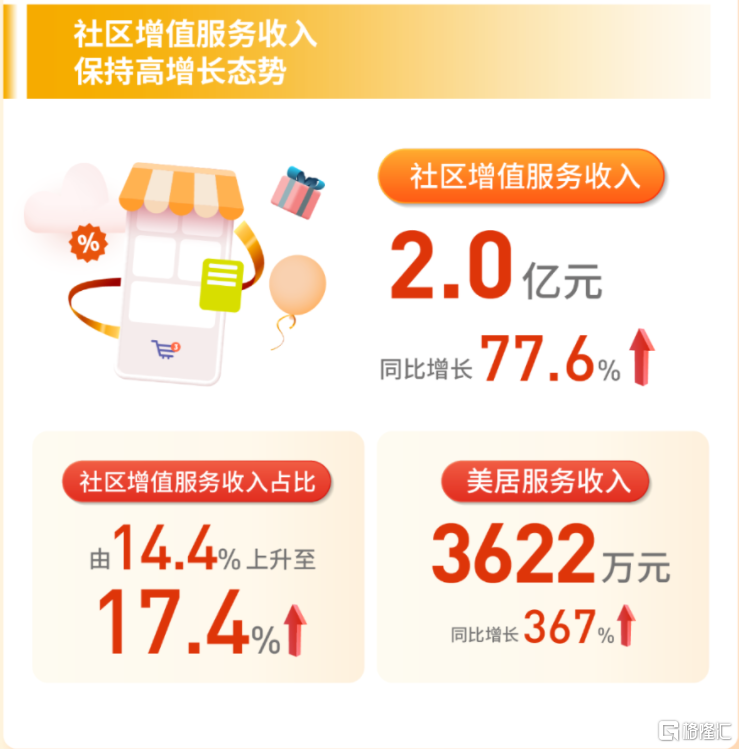
截止至2021年12月31日,弘陽服務實現營業收入為11.3億元,同比增長47.2%。從收入構成看,公司物業管理業務、非業主增值業務、社區增值服務這三條業務主線均實現了不同程度的增長。具體來看,物業管理服務為主要收入來源,依託於快速增長的在管面積,該板塊收入約為7.5億元,較2020年同期增長了51.9%,佔總收入66.6%;非業主增值服務收入的增加主要來自於案場協銷服務收入的增加,實現收入1.8億元,同比增長11.8%,佔總收入16%;社區增值服務實現收入1.96億元,同比增長77.6%,佔總收入17.4%。
值得注意的是,公司近年來積極拓展社區內可用資源,其社區增值服務業務成為了公司着重發展的業務,業績增長持續亮眼,有望成為助推公司業績穩步提升的第二增長引擎。其中,由於2021年,弘陽服務與弘陽傢俱打通渠道,實現資源的良好互補,美居服務業務的業績增長尤為顯著,實現收入約0.36億元,同比增長了367%。未來隨着公司服務品質不斷優化及其業態逐步擴大,有助於提升客户粘性,為公司健康穩定地發展帶來了重要的支撐。
(信息來源:公司官網)
從盈利能力來看,弘陽服務依然保持穩健發展的態勢。據2021年度報吿顯示,淨利潤同比增長48.2%,毛利率同比增長0.5%;股東應占溢利同比增長42.6%,可見,經過十餘年的深耕,公司已形成強抗風險能力以及抗週期能力,展現出弘陽服務跨週期發展的硬核實力。
外拓能力持續加強,區域性優勢明顯
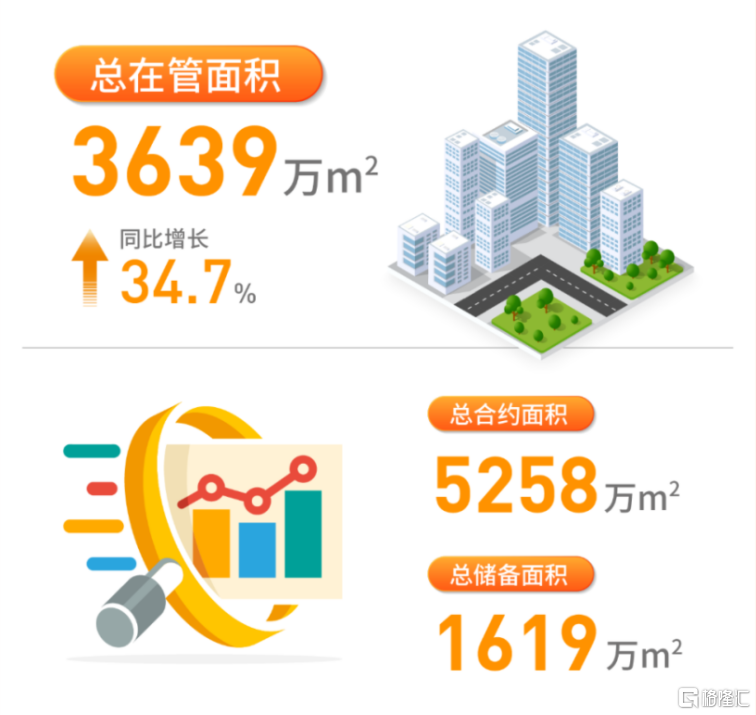
自創立以來,弘陽服務始終秉承着“做透大江蘇、深耕長三角、佈局都市圈”的戰略佈局,憑藉其敏鋭的市場觸覺以及行業深耕經驗,積極應對市場變化,在鞏固江蘇省市場份額的同時,不斷提升其他核心城市的市場份額,進而提升公司在業內的市場競爭力以及品牌影響力。截止至2021年年末,弘陽服務在管項目數量為234個,簽約建築面積約為5258.8萬平方米,其中在管建築面積約為3639.3萬平方米,同比增長了34.7%。
(信息來源:公司官網)
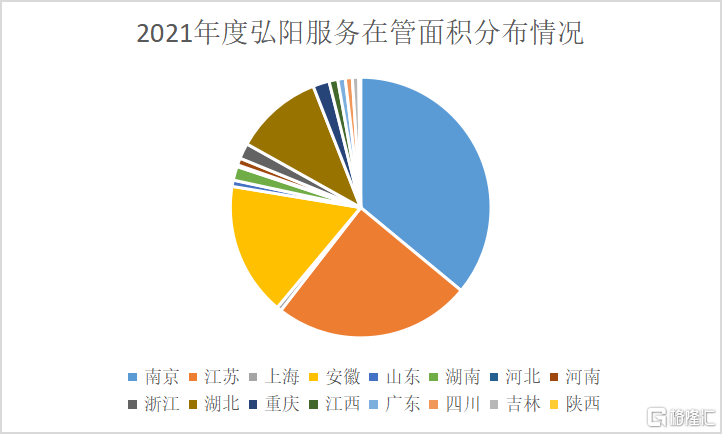
從區域分佈來看,南京作為公司的大本營,依舊佔據較大的市場份額,項目數量從去年同期75個增長至93個,在管建築面積達到1309.9萬平方米;而江蘇省作為公司戰略佈局的重要之地,項目數量為52個,其在管建築面積達到892.02萬平方米;其次為安徽省在管建築面積601.47萬平方米,湖北省398.72萬平方米、重慶省73.61萬平方米、浙江省70.22萬平方米等等。可見,弘陽服務在發揮區域優勢的同時,不斷擴大市場規模,逐步提升自身的市場滲透率,展現出了其潛在的成長空間與價值。
(信息來源:公司公吿)
積極佈局多元化業態,助推業績增長
隨着物業行業的加速成長,物業企業已經從傳統的“四保業務”逐步衍生出多種增值服務及專業化服務。對此,弘陽服務積極迎合行業發展趨勢,把握市場機會,積極探索“城市服務”等新的業務形態,進一步擴大服務邊界,降低對母公司的依賴,築建自身強大的護城河。近年來,弘陽服務與滁州宇潤物業管理有限公司、武漢匯得行精英物業服務有限公司達成股權合作,加強公司在區域、業態方面的互補,不僅如此,公司不斷延伸服務邊界,加強城市服務佈局,填補了產業園、教育等方面的空白。
據最新報吿顯示,公司第三方房地產開發商的項目數量達到148個項目,在管面積為2120.77萬平方米,新增項目59個,其佔比也從55.97%躍升至63.25%。未來隨着公司多元化業態不斷深化,業務版圖有望進一步擴大,有望對公司整體的估值帶來提升機會。
Follow us
Find us on
Facebook,
Twitter ,
Instagram, and
YouTube or frequent updates on all things investing.Have a financial topic you would like to discuss? Head over to the
uSMART Community to share your thoughts and insights about the market! Click the picture below to download and explore uSMART app!

Disclaimers
uSmart Securities Limited (“uSmart”) is based on its internal research and public third party information in preparation of this article. Although uSmart uses its best endeavours to ensure the content of this article is accurate, uSmart does not guarantee the accuracy, timeliness or completeness of the information of this article and is not responsible for any views/opinions/comments in this article. Opinions, forecasts and estimations reflect uSmart’s assessment as of the date of this article and are subject to change. uSmart has no obligation to notify you or anyone of any such changes. You must make independent analysis and judgment on any matters involved in this article. uSmart and any directors, officers, employees or agents of uSmart will not be liable for any loss or damage suffered by any person in reliance on any representation or omission in the content of this article. The content of the article is for reference only and does not constitute any offer, solicitation, recommendation, opinion or guarantee of any securities, virtual assets, financial products or instruments. Regulatory authorities may restrict the trading of virtual asset-related ETFs to only investors who meet specified requirements. Any calculations or images in the article are for illustrative purposes only.
Investment involves risks and the value and income from securities may rise or fall. Past performance is not indicative of future performance. Please carefully consider your personal risk tolerance, and consult independent professional advice if necessary.


