基本驅動因素如何影響總股票回報率
股票回報驅動因素
雖然有成千上萬的變量可能會影響股票價格,但在較長的時間跨度下來看,基本可以歸結爲基本面驅動因素和倍數擴張/收縮驅動因素。基本面驅動因素包括盈利增長和對股東的資本分配,這個分配形式可以是股息或着是回購。另外,倍數擴張因素涉及大量的信息,包括特異性表現以及系統環境。特異性表現如:經營槓桿,資本回報率 (ROIC= (淨收入-稅收) / 總資本 ),商業護城河以及競爭優勢等;而系統環境包括:利率,通脹,匯率,稅率,地緣政治事件等。
本文試圖通過對11只巨盤股的分析,把握在過去9年中,這些驅動因素對各股的總回報的貢獻度。
這11只巨盤股包括大型科技集團,以及不同行業的其他大型股——
蘋果(AAPL),微軟(MSFT),谷歌(GOOGL),亞馬遜(AMZN),臉書(FB),伯克希爾哈撒韋公司(BRK.A),聯合健康集團 (UNH),埃克森美孚(XOM),家得寶 (HD),Visa(V),Costco (COST)
具體操作與結果
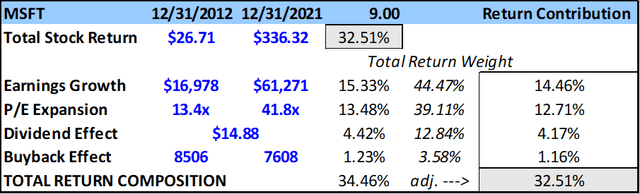
爲了計算每個公司的收益構成:記錄起始年度和最近一個完整財政年度的淨收入總額;在起始年度和最近一個財政年度結束時的價格、攤薄股票數量和長期市盈率;以及該期間的股息支付總額(每股)。
記錄淨利潤增長的複合年增長率(CAGR)、P/E擴張(收縮)、股票數量的變化(回購效應的反比),並將收到的總股息除以最近記錄的股價。把所有這些加起來,得到了總回報組合。
由於總回報構成與總價格回報略有差異,因此將每個因素(收益增長、市盈率擴張(收縮)、股息和回購效應)的權重與總股票回報複合年增長率相乘:

總結
雖然上述的研究分析不夠完美: (1)收益貢獻因素(收益、市盈率擴張、股息效應、回購效應)加起來與同期的實際總股價回報並不完全一致(其實,對於大多數公司來說,這一差距僅在250個基點以內);(2)所涵蓋的時間段還不足以提供一個更全面的視角,以瞭解在長期框架內不同經濟週期中的驅動因素的效果。
但依然能夠相信,從長期來看(20年以上),收益增長和投資資本回報率是股票總回報最密切相關的因素。在過去9年中,仍然看到收益、回購、股息和倍數擴張(收縮)對特定股票的影響是非常大的。臉書和亞馬遜的爆炸性增長帶來了倍數壓縮,顯示出這些企業走向成熟的道路。而且有趣的是,他們的回報貢獻看起來與最老牌的公司之一伯克希爾哈撒韋公司非常相似。
另外,由倍數擴張帶來巨大收益的公司(蘋果、微軟、聯合健康集團和好市多),在所研究的這段時間裏,隨着競爭優勢的增長,倍數也在擴大。我們認爲,利率下降、公司稅率降低和穩定的通脹等系統性因素也有助於這一時期的倍數擴張。與過去9年裏更依賴收益增長的公司(Alphabet、伯克希爾哈撒韋、家得寶和Visa)相比,瞭解系統環境隨時間的變化可能會對這些頭寸產生不同的影響。
Follow us
Find us on
Facebook,
Twitter ,
Instagram, and
YouTube or frequent updates on all things investing.Have a financial topic you would like to discuss? Head over to the
uSMART Community to share your thoughts and insights about the market! Click the picture below to download and explore uSMART app!

Disclaimers
uSmart Securities Limited (“uSmart”) is based on its internal research and public third party information in preparation of this article. Although uSmart uses its best endeavours to ensure the content of this article is accurate, uSmart does not guarantee the accuracy, timeliness or completeness of the information of this article and is not responsible for any views/opinions/comments in this article. Opinions, forecasts and estimations reflect uSmart’s assessment as of the date of this article and are subject to change. uSmart has no obligation to notify you or anyone of any such changes. You must make independent analysis and judgment on any matters involved in this article. uSmart and any directors, officers, employees or agents of uSmart will not be liable for any loss or damage suffered by any person in reliance on any representation or omission in the content of this article. The content of the article is for reference only and does not constitute any offer, solicitation, recommendation, opinion or guarantee of any securities, virtual assets, financial products or instruments. Regulatory authorities may restrict the trading of virtual asset-related ETFs to only investors who meet specified requirements. Any calculations or images in the article are for illustrative purposes only.
Investment involves risks and the value and income from securities may rise or fall. Past performance is not indicative of future performance. Please carefully consider your personal risk tolerance, and consult independent professional advice if necessary.


