乘聯會:全國乘用車產能利用率為52.47%,處於產能嚴重過剩的區間
本文來自:乘聯會
結束3年連續的負增長,終於轉成了正增長。乘用車市場信息聯席會發布的統計數據顯示,2021年國內汽車生產企業廣義乘用車(包括微型汽車)銷售2145.6萬輛、同比增長6.6%。
截止2021年底,全國乘用車產能合計4089萬輛,產能利用率為52.47%。雖然比2020年的48.45%提高4%,但還是處於產能嚴重過剩的區間。
根據乘聯會的統計,2021年有銷量的企業是86家。這些企業合計產能為3703.8萬輛,相應的總體產能利用率為57.93%。可見,在乘用車總產能中,其餘企業有385萬輛產能是完全閒置的。
86家企業的產能利用率分析如下。
表1是用按企業銷售量排序,分析企業產能利用率總體情況的結果。
表1 2021年乘用車產能按企業銷售量的分析
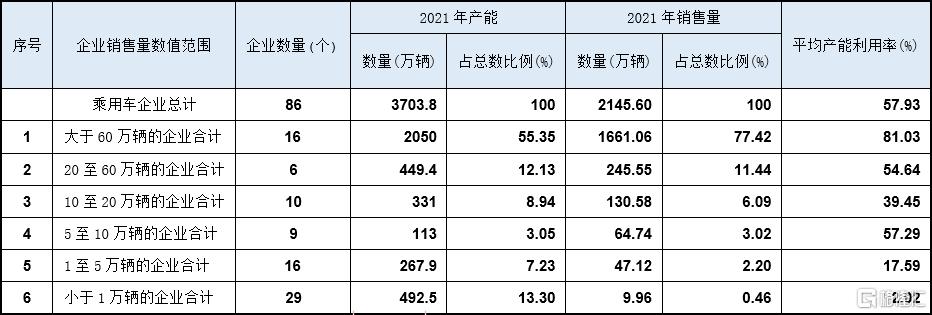
銷量大於60萬輛的16家企業,合計銷量1661.06萬輛、佔總銷量的77.42%,合計產能2039萬輛、佔總產能的近50%。這16家企業的平均產能利用率為81.03%,處於合理區間。
銷量大於20萬輛的22家企業,合計銷量佔總銷量88.86%,給其他64家企業留下的市場份額只有不到13%。
有29家企業的銷量少於1萬輛,這些企業的產能佔了總數的13%,而銷量只佔總數的0.46%,平均產能利用率只有2.02%。
即使在銷量數據各區間段內,具體企業各自的產能利用率也是差別非常大的。
表2是按企業產能利用率數值排序,分析企業產能利用率總體情況的結果。
表2 2021年乘用車產能按企業產能利用率大小的分析
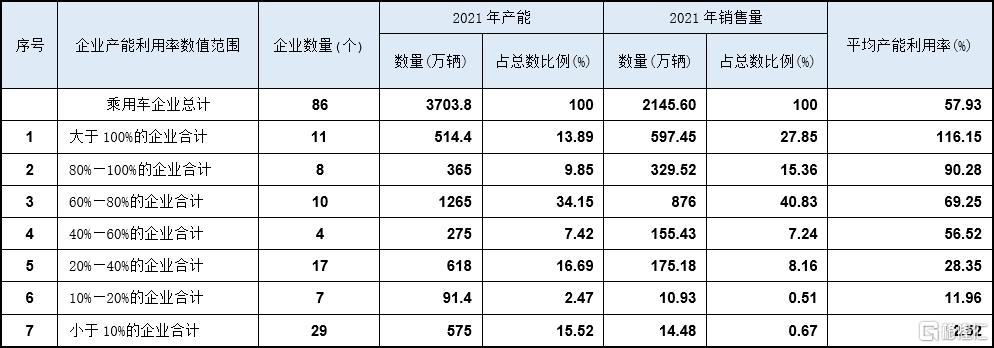
有11家企業的產能利用率高於100%,基本上是已經開足三班制,休息日還得適當加班。11家企業中,有6家是外資在中國的獨資或合資企業,5家是內資企業。2021年有4家新能源汽車企業的產能利用率超過100%,其中包括特斯拉。
8家企業產能利用率在80%-100%之間,其中合資企業3家、新能源汽車企業3家,產能屬於處在正常狀態。
10家企業產能利用率在60%-80%之間,其中合資企業有4家,應該是產能還有富餘。
4家企業產能利用率在40%-60%之間,其中有3家主流汽車企業是由於近年來銷量大幅減少,而使產能利用率降低。
其餘的企業產能肯定是過剩,甚至是嚴重過剩的。尤其是29家企業產能利用率不足10%。這些規模較小、銷量較低的企業,不僅產能嚴重過剩,在行業有6.6%增長時,不少企業依然是負增長。如無根本性的改變,這類企業扭轉產能過剩的狀況基本無望。
在乘用車產能總體過剩的情況下,已經具備生產資質的企業還有1046萬輛在建產能將陸續建成投產。
2021年新能源乘用車銷售332.6萬輛,而新能源乘用車的專用產能已經有569.5萬輛,產能利用率是58.4%。而在建產能大部分是新能源汽車,傳統汽車企業的現有產能部分也可共線生產新能源汽車。
因此,汽車行業在解決傳統汽車產能過剩問題的同時,還要防止新能源汽車產能過剩。
Follow us
Find us on
Facebook,
Twitter ,
Instagram, and
YouTube or frequent updates on all things investing.Have a financial topic you would like to discuss? Head over to the
uSMART Community to share your thoughts and insights about the market! Click the picture below to download and explore uSMART app!

Disclaimers
uSmart Securities Limited (“uSmart”) is based on its internal research and public third party information in preparation of this article. Although uSmart uses its best endeavours to ensure the content of this article is accurate, uSmart does not guarantee the accuracy, timeliness or completeness of the information of this article and is not responsible for any views/opinions/comments in this article. Opinions, forecasts and estimations reflect uSmart’s assessment as of the date of this article and are subject to change. uSmart has no obligation to notify you or anyone of any such changes. You must make independent analysis and judgment on any matters involved in this article. uSmart and any directors, officers, employees or agents of uSmart will not be liable for any loss or damage suffered by any person in reliance on any representation or omission in the content of this article. The content of the article is for reference only and does not constitute any offer, solicitation, recommendation, opinion or guarantee of any securities, virtual assets, financial products or instruments. Regulatory authorities may restrict the trading of virtual asset-related ETFs to only investors who meet specified requirements. Any calculations or images in the article are for illustrative purposes only.
Investment involves risks and the value and income from securities may rise or fall. Past performance is not indicative of future performance. Please carefully consider your personal risk tolerance, and consult independent professional advice if necessary.


