21Q4機構銀行持倉降至低位,繼續積極看多
本文來自:志明看金融,作者:廖志明、邵春雨
多數時期銀行業指數走勢與機構持倉比例呈較強的正相關性。本篇報吿根據歷年主動偏股公募基金的重倉持股數據進行統計分析,其中主動偏股公募基金主要包括普通股票型基金、偏股混合型基金、靈活配置型基金和平衡混合型基金。
1、21Q4機構重倉銀行板塊市值比例環比下降至2.94%
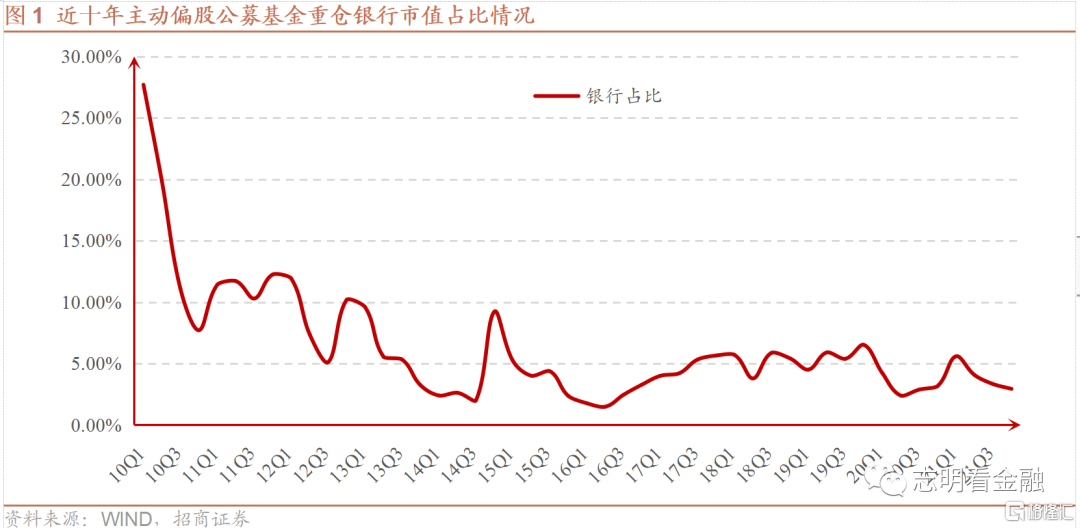
21Q4主動偏股公募基金重倉銀行板塊佔比為2.94%,環比下降了0.39個百分點。19年末公募重倉銀行板塊市值佔比曾達到6.52%的高位,20年前兩個季度持續下跌, 20Q3止跌啟升,21Q1回升至5.6%,21年後三個季度佔比持續下跌。21Q2、21Q3、21Q4重倉銀行板塊市值佔比下持續下行一方面反映21年下半年市場對經濟下行的預期,另一方面是主要由於個別房企流動性危機發酵,引發市場擔憂資產質量。
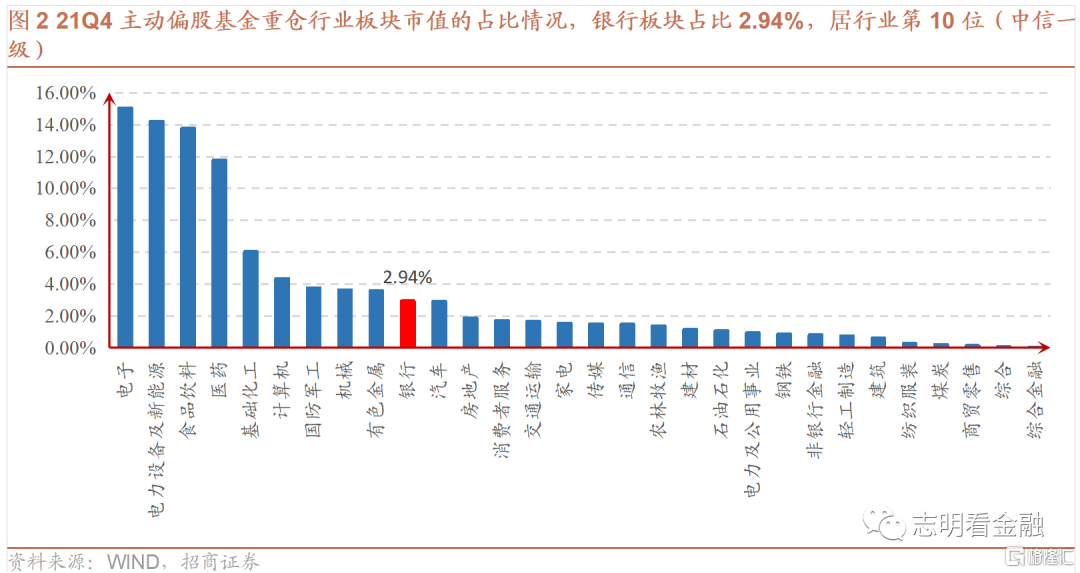
分行業來看,21Q4主動偏股公募基金重倉市值佔比前四名為電子、電力設備及新能源、食品飲料、醫藥。銀行板塊2.9%的佔比在中信一級行業中排名第10位,環比下降1名。
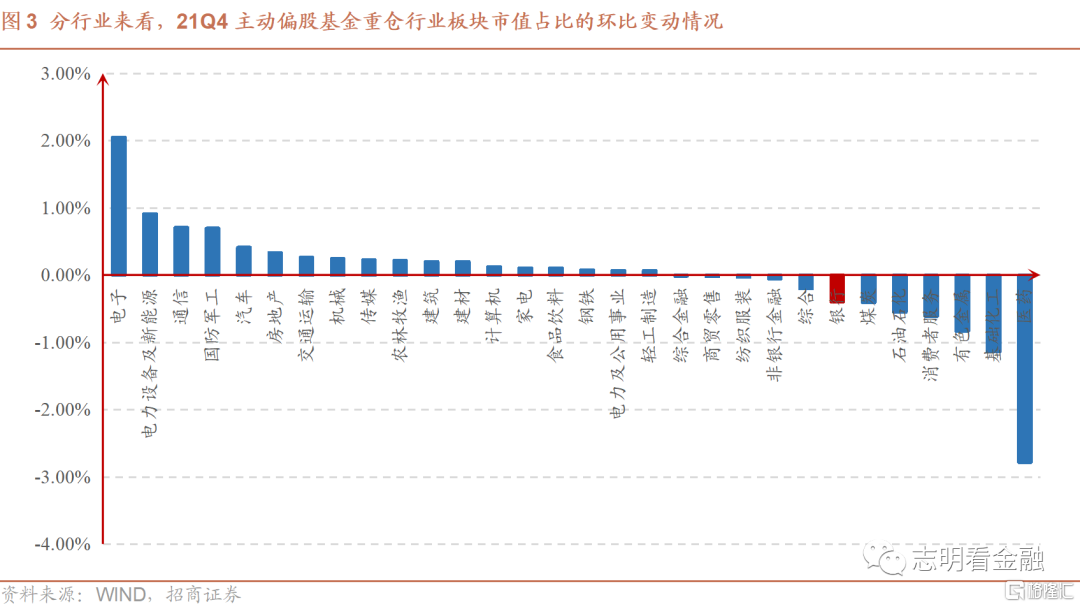
從行業佔比變動來看,21Q4基金重倉銀行市值佔比環比下降0.39個百分點,同樣佔比環比下降幅度較大的還有醫藥,醫藥下降2.78個百分點;提升幅度較大的是電子行業,電子行業環比提升2.05個百分點。
2、Q4機構明顯增配寧波銀行,持倉市值普遍下降
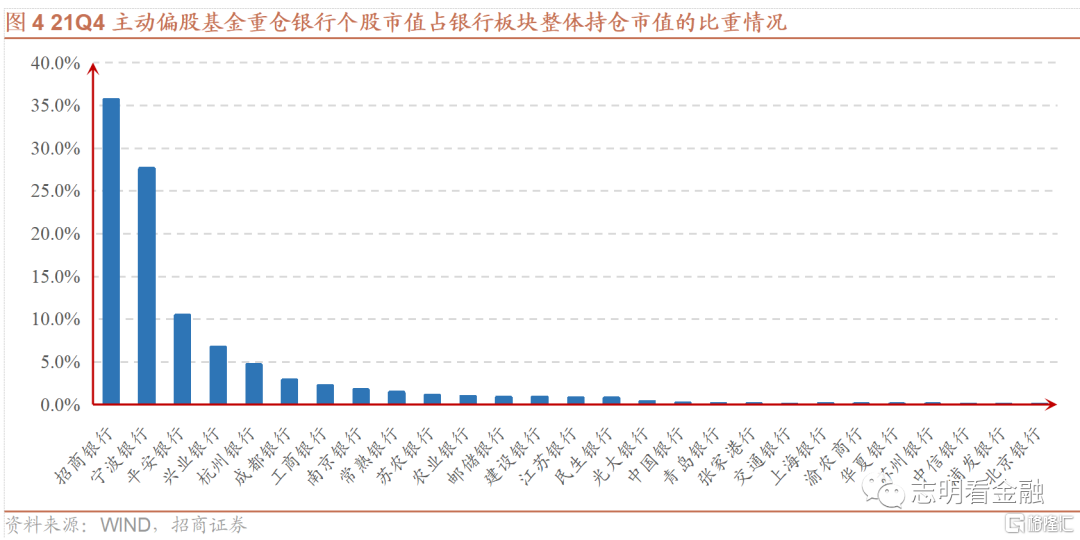
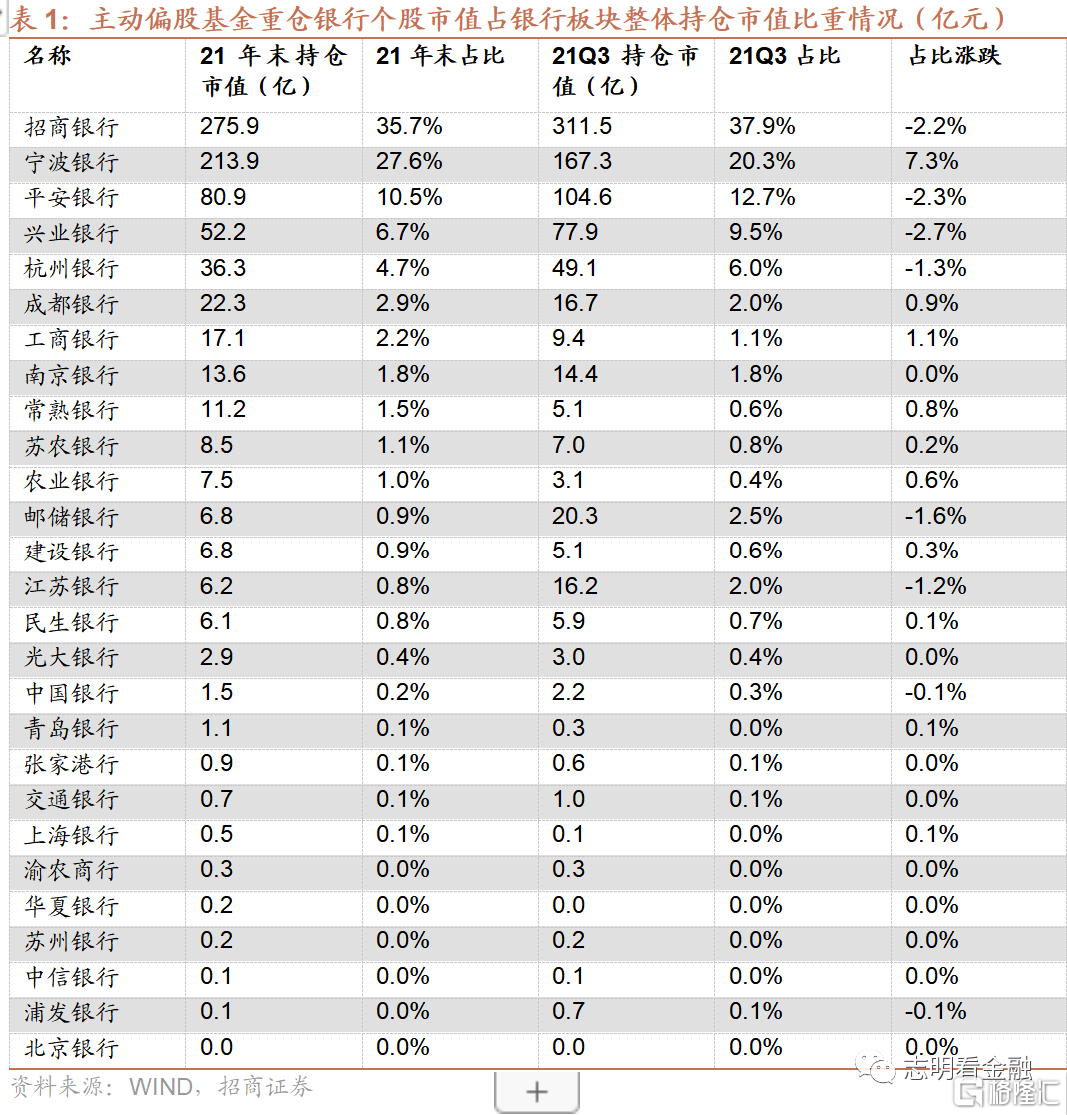
銀行重倉股集中度高。21Q4有27家銀行進入主動偏股基金重倉股榜單,與三季度末相比,銀行板塊內持倉市值佔比前5名不變,依次為招行、寧波、平安、興業、杭州,主要為業績持續向好的高ROE銀行。前5名佔板塊整體持倉市值比重合計為85.2%,其中招行、寧波和平安分別佔據35.7%、27.6%和10.5%。
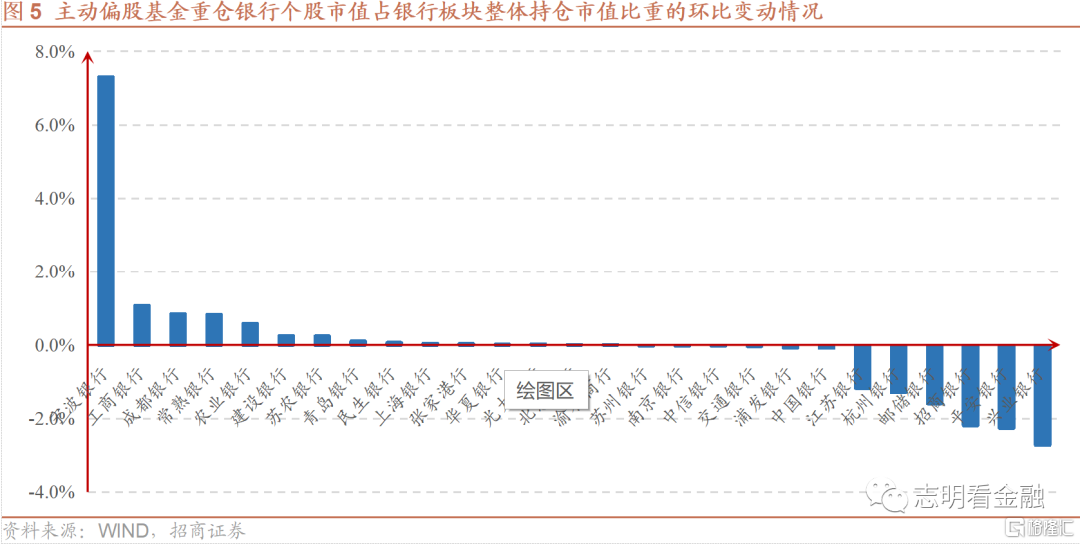
Q4機構增配寧波銀行,持倉市值普遍下降。從季度環比變化來看,21Q4板塊內持倉市值佔比提升較多的銀行為寧波銀行、工商銀行、成都銀行、常熟銀行、農業銀行,其中寧波銀行環比提升7.3個百分點,21年12月寧波銀行配股上市,配股對股價的影響到位,當前估值較低,機構增配。21Q4興業銀行、平安銀行、招商銀行持倉佔比下降明顯,分別環比下降2.7/2.3/2.2個百分點,和四季度股價回調有關。
主動偏股基金重倉銀行板塊市值環比減少5.9%,降速放緩。從持倉市值絕對值來看,21年3季度末主動偏股基金重倉銀行板塊市值總計為773.6億元,環比下降5.9%,降幅較Q3有所減緩(21Q3環比下降18.6%)。
3、投資建議
21Q4機構重倉股銀行佔比降至2.9%之低位,繼續積極看多
我們自12月中旬中央經濟會議重提逆週期調控以來,持續旗幟鮮明積極看多銀行。我們認為,2022年穩增長之下,社融增速有望小幅回升,宏觀利率環境類似2019年,連續兩年未漲的銀行板塊漲幅有望比肩2019年,或達20%。近期,業績快報大多靚麗,有望催化1月行情再進一步。
個股方面,我們主推估值較低、業績靚麗的優質銀行-江蘇、南京、常熟、興業及平安銀行等,看好估值相對較高的財富管理龍頭-寧波銀行等。
4、風險提示
金融讓利,信貸需求走弱,息差收窄;資產質量惡化等。
Follow us
Find us on
Facebook,
Twitter ,
Instagram, and
YouTube or frequent updates on all things investing.Have a financial topic you would like to discuss? Head over to the
uSMART Community to share your thoughts and insights about the market! Click the picture below to download and explore uSMART app!

Disclaimers
uSmart Securities Limited (“uSmart”) is based on its internal research and public third party information in preparation of this article. Although uSmart uses its best endeavours to ensure the content of this article is accurate, uSmart does not guarantee the accuracy, timeliness or completeness of the information of this article and is not responsible for any views/opinions/comments in this article. Opinions, forecasts and estimations reflect uSmart’s assessment as of the date of this article and are subject to change. uSmart has no obligation to notify you or anyone of any such changes. You must make independent analysis and judgment on any matters involved in this article. uSmart and any directors, officers, employees or agents of uSmart will not be liable for any loss or damage suffered by any person in reliance on any representation or omission in the content of this article. The content of the article is for reference only and does not constitute any offer, solicitation, recommendation, opinion or guarantee of any securities, virtual assets, financial products or instruments. Regulatory authorities may restrict the trading of virtual asset-related ETFs to only investors who meet specified requirements. Any calculations or images in the article are for illustrative purposes only.
Investment involves risks and the value and income from securities may rise or fall. Past performance is not indicative of future performance. Please carefully consider your personal risk tolerance, and consult independent professional advice if necessary.


