除了白酒,細分酒類中還有什麼酒能投?
本文來自:蘇寧金融研究院,作者:黃大智
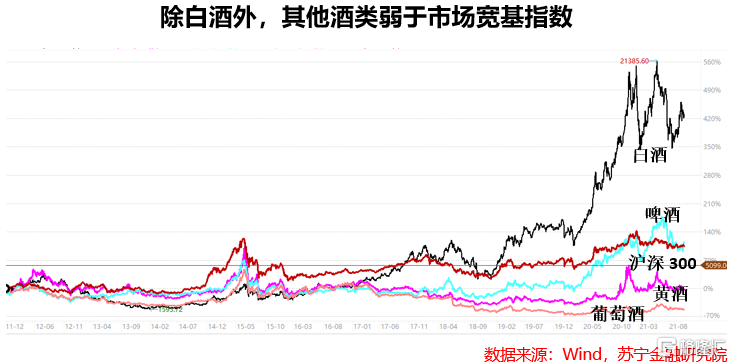
在A股市場中,“酒”類投資一直是一個很特殊的存在。一方面,整個酒類市場的收入規模在不斷增長,二級市場中的投資價值也高。另一方面,整個酒類中基本是白酒一枝獨秀,重倉白酒的基金經理也在過去幾年獲得了極大的成功。公募中的易方達張坤、景順劉彥春等,私募中的林園、馮柳等都曾靠重倉高端白酒取得了很高的超額業績。但白酒之外的啤酒、黃酒、葡萄酒表現卻極其慘淡。如果看過去十年收益表現,白酒之外的細分酒類,都比市場寬基指數滬深300表現更差,行業基本不存在超額收益。其中的黃酒與葡萄酒更差,如果按照整體指數看,葡萄酒基本是一路下跌的趨勢,黃酒雖然中間有反彈,但至今尚未回到2015年高點,基本算是“一套十年”。
除了白酒外,還有什麼酒具備投資價值?
在此前的文章中,我們分析了白酒基金的投資價值。但是除了白酒外,在細分酒類中,啤酒市場也確實具備一定的市場空間和投資價值,驗證這個結論,可以從幾個方面來看待這個問題。
一是市場規模和表現。按照申萬行業分類看,A股黃中葡萄酒成分股有5只,總市值爲300億左右;黃酒成分股有3只,總市值爲200億左右;啤酒成分股有7只,總市值爲2500億左右,其中在500億以上的有重慶啤酒和青島啤酒。
其中黃酒具有極強的地域屬性,江浙滬地區市場份額佔比超過80%,市場份額在不斷縮減,長期投資價值較小。
紅酒曾經是一個很被看好的市場,邏輯在於中國平均的紅酒消費水平比西方小的多的多。但從實踐看,紅酒附帶的文化屬性與中國的傳統文化有些格格不入。又由於產地的因素,國內紅酒又不具備進軍高端市場的條件,因此葡萄酒龍頭“張裕”表現也比較慘淡,這也基本代表了紅酒市場在中國的發展情況。
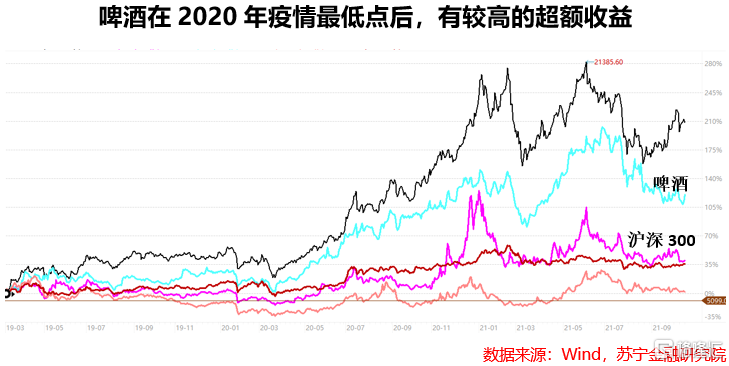
啤酒整體雖然在較長時間內表現的比市場寬基指數還差,但從2020年3月疫情最低點後,有了一波較好的行情,因此我們可以簡單分析其投資價值。
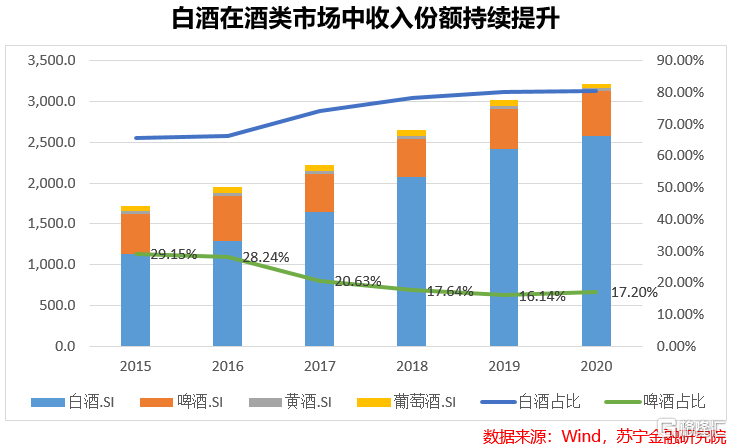
二是從收入情況看。酒類市場中,白酒的收入規模從2015年的66%提升至2020年底的80%。啤酒的收入規模從2015年的29%到17%,而其他酒類收入佔比較小。雖然啤酒收入的佔比在逐漸縮減,但仍能夠在酒類市場中佔據一席之地。
更值得注意的一點是,啤酒在整個酒類市場中收入的份額在2020年有了止跌回升的趨勢,這一定程度上能夠打開啤酒市場的想象空間。
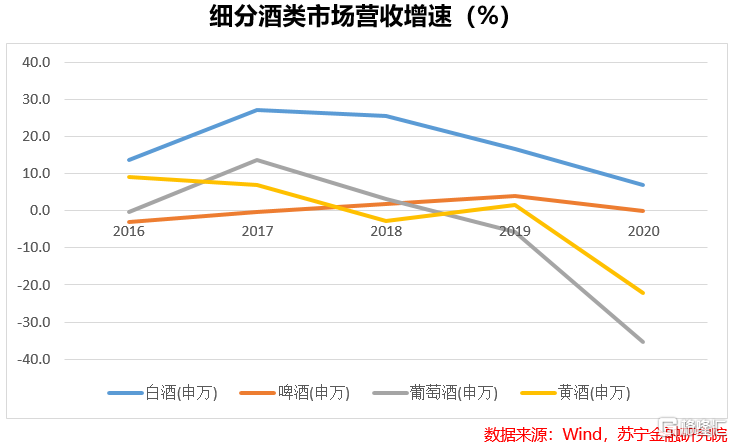
三是從收入增長的角度看,啤酒受益於消費升級,龍頭企業採取了高端化戰略,雖然銷量減少,但相比之下提價策略保證了營收和利潤的增長,近幾年市場整體也都保持了一定的增長。
因此,整體來看,除了白酒之外,啤酒市場具備一定的投資前景和價值。
哪些基金在投資啤酒
和土生土長的白酒的不同,中國啤酒的生產技術主要由國外引進而來的。但是在發展階段上,啤酒和白酒很類似,目前都處於量減價升的階段,啤酒產銷量自2013年起逐漸下降,行業走向去產能的道路。
在這樣一個縮量的市場中,行業龍頭的優勢顯著,頭部啤酒企業如青島啤酒、重慶啤酒、珠江啤酒、燕京啤酒增長的邏輯在於市場份額的提升。因此啤酒廠商的渠道管理、市場推廣、品牌、銷售等要素成爲競爭中的關鍵因素。
在龍頭企業引領啤酒市場的情況下,機構對於啤酒市場也主要是佈局頭部啤酒企業,特別是青島啤酒和重慶啤酒。
以2021年三季度爲截止日期,同時持有青島啤酒、重慶啤酒的基金主要是消費或食品飲料行業的主動管理基金。同時,我們將基金中啤酒企業市值佔比定義爲“含啤量”,可以得出以下結果。
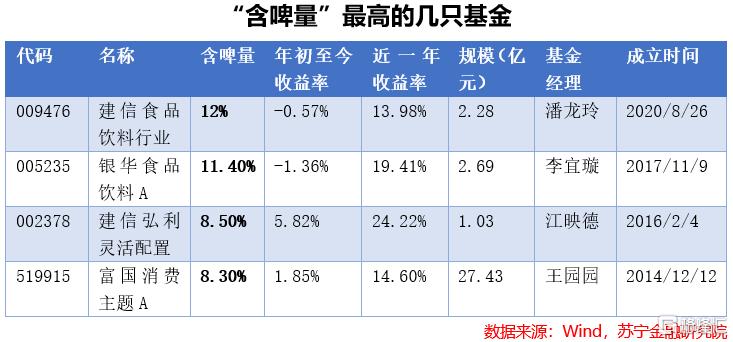
在限定“含啤量”較高的前提下,我們可以簡單對比這幾隻基金的投資價值。
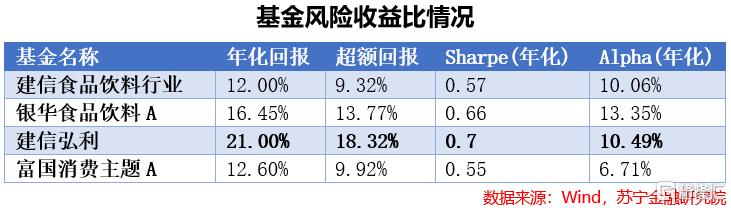
從風險收益的角度考量,建信弘利的夏普比率最高,超額業績也比較明顯。對投資者而言,投資的性價比也最高。
Follow us
Find us on
Facebook,
Twitter ,
Instagram, and
YouTube or frequent updates on all things investing.Have a financial topic you would like to discuss? Head over to the
uSMART Community to share your thoughts and insights about the market! Click the picture below to download and explore uSMART app!

Disclaimers
uSmart Securities Limited (“uSmart”) is based on its internal research and public third party information in preparation of this article. Although uSmart uses its best endeavours to ensure the content of this article is accurate, uSmart does not guarantee the accuracy, timeliness or completeness of the information of this article and is not responsible for any views/opinions/comments in this article. Opinions, forecasts and estimations reflect uSmart’s assessment as of the date of this article and are subject to change. uSmart has no obligation to notify you or anyone of any such changes. You must make independent analysis and judgment on any matters involved in this article. uSmart and any directors, officers, employees or agents of uSmart will not be liable for any loss or damage suffered by any person in reliance on any representation or omission in the content of this article. The content of the article is for reference only and does not constitute any offer, solicitation, recommendation, opinion or guarantee of any securities, virtual assets, financial products or instruments. Regulatory authorities may restrict the trading of virtual asset-related ETFs to only investors who meet specified requirements. Any calculations or images in the article are for illustrative purposes only.
Investment involves risks and the value and income from securities may rise or fall. Past performance is not indicative of future performance. Please carefully consider your personal risk tolerance, and consult independent professional advice if necessary.


