冠澤醫療赴港IPO:年內溢利2904萬,核心產品市場規模縮水
據格隆匯新股瞭解,Guanze Intelligent Medical Information Industry (Holding) Co., Ltd.(以下簡稱“冠澤醫療”)於9月27日向港交所主板遞交上市申請,西證國際爲其獨家保薦人。
IPO前,孟先生通過Meng A Capital持有公司94.05%股份,孟先生及Meng A Capital爲控股股東集團。湯博士通過Tang Operation持有0.95%股份,蘇先生則通過潤億持有公司5%股份。
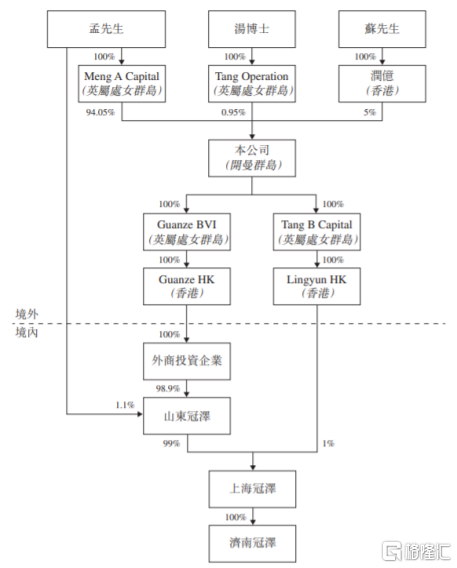
(IPO前公司股權架構,來源:招股說明書)
01
收入均來自山東
冠澤醫療是一家立足於山東省的醫學影像解決方案提供商,主要從事提供醫用影像膠片產品及醫學影像雲服務。
2018年-2020年,冠澤醫療收入及利潤不斷增長,實現收入由1.31億元增長至1.84億元;同期溢利由1254.9萬元增長至2904.3萬元。毛利率水平則由27%上升至33.4%。2021年上半年,冠澤醫療實現收入同比增長10.5%至1.07億元,期間溢利同比下降16%至1116.7萬元。
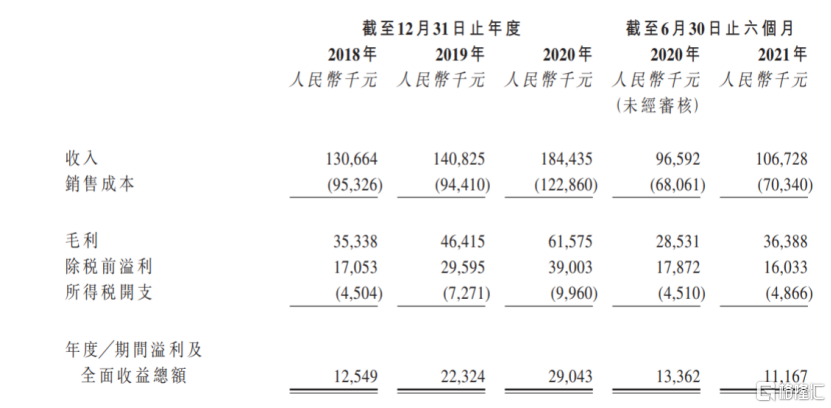
(公司主要財務數據,來源:招股說明書)
分業務來看,醫用影像膠片產品業務貢獻公司絕大部分收益,佔當期營收比重達到90%左右,毛利率在30%;提供醫學影像雲服務的毛利率雖高達80%以上,但其收入佔比僅在6%,規模相對較小。
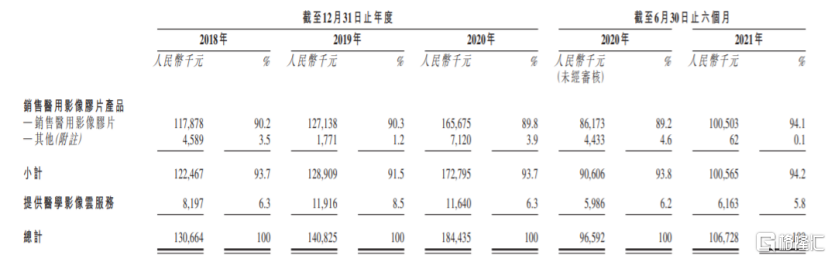
(公司主營收入結構,來源:招股說明書)
冠澤醫療主要客戶集中在山東地區,目前已經覆蓋超過40家三級醫院及50家二級或以下醫院。按2020年銷售量來看,公司是醫學影像產品生產商在山東省的最大二級分銷商。就醫學影像雲服務業務而言,其是山東省第三大醫學影像雲服務供應商,佔市場份額約4.7%。
報告期內,冠澤醫療所有收入及溢利均來自山東省,拋開未知的政策、市場變化風險,雖帶來較爲穩定的收入來源,但收入過於集中,也容易觸碰天花板,同時也顯現出公司對外開拓能力不足。
02
核心產品增長受限
冠澤醫療未來業績增長離不開行業發展空間。
中國醫用影像膠片產品市場規模由2015年的53億元增長至2020年的66億元,複合年增長率爲4.5%,由於該市場相對成熟,且數碼醫用影像膠片的替代趨勢,預計2030年該市場規模將降低至48億元。就山東市場來說,該市場規模也呈現下滑態勢,預計2030年降至3.6億元。
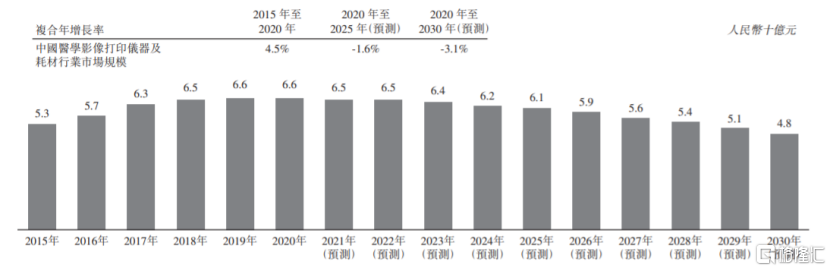
(中國醫用影像膠片產品行業的市場規模,來源:灼識諮詢)
不僅市場規模不斷縮小,中國醫用影像膠片產品市場還是個高度集中的市場。前5大製造商佔據該市場70%的份額。山東省醫用影像膠片產品市場前三大的製造商也已佔據80%以上的市場份額。
由此可見,冠澤醫療在醫用影像膠片產品業務上增長的空間並不大,出省破圈也是難事。
而隨着信息技術的快速發展,以及雲服務帶來的效率提升,中國醫學影像雲服務市場將快速增長。該市場規模由2015年的5億元增長至2020年27億元,複合年增長率達37.3%,預計2030年將進一步增長至174億元,複合年增長率達20.6%。山東省而言,預計2030年將達到約15億元。
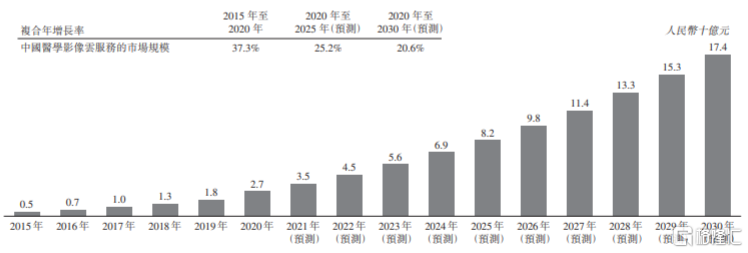
(中國醫學影像雲服務市場規模,來源:灼識諮詢)
目前,冠澤醫療雖排名在山東省醫學影像雲平臺市場第三名,但其市場份額也僅佔4.7%,前兩名均佔據6%以上,還未出現具有相對地位優勢的公司。可以說,冠澤醫療有機會,但挑戰很大。
03
小結
冠澤醫療依靠銷售醫用影像膠片產品獲得較爲穩定的收入來源,並在山東地區佔據一定市場地位。然而,這個市場天花板明顯,且隨着信息技術的更新趨勢,存在被替代風險。在此背景下,公司更應注重醫學影像雲服務市場的開拓,但這個市場處於起步階段,公司能否出圈仍需打一個問號。
Follow us
Find us on
Facebook,
Twitter ,
Instagram, and
YouTube or frequent updates on all things investing.Have a financial topic you would like to discuss? Head over to the
uSMART Community to share your thoughts and insights about the market! Click the picture below to download and explore uSMART app!

Disclaimers
uSmart Securities Limited (“uSmart”) is based on its internal research and public third party information in preparation of this article. Although uSmart uses its best endeavours to ensure the content of this article is accurate, uSmart does not guarantee the accuracy, timeliness or completeness of the information of this article and is not responsible for any views/opinions/comments in this article. Opinions, forecasts and estimations reflect uSmart’s assessment as of the date of this article and are subject to change. uSmart has no obligation to notify you or anyone of any such changes. You must make independent analysis and judgment on any matters involved in this article. uSmart and any directors, officers, employees or agents of uSmart will not be liable for any loss or damage suffered by any person in reliance on any representation or omission in the content of this article. The content of the article is for reference only and does not constitute any offer, solicitation, recommendation, opinion or guarantee of any securities, virtual assets, financial products or instruments. Regulatory authorities may restrict the trading of virtual asset-related ETFs to only investors who meet specified requirements. Any calculations or images in the article are for illustrative purposes only.
Investment involves risks and the value and income from securities may rise or fall. Past performance is not indicative of future performance. Please carefully consider your personal risk tolerance, and consult independent professional advice if necessary.


