


上萬億的市場量能,或許在未來是一個常態化,帶來最大的好處是市場板塊能夠得到很好承接,使得指數不會產生下殺的情緒,市場的有效性反饋非常強。
但是,高位股的調整變成高波動性,以新能源、光伏、上游礦為主的區域,不是漲停就是跌停,以往被抽血的區域開始迎來資金的迴流。
那麼,高位股暴跌VS價值股迴歸,造成高波動性的原因在哪?哪個才是後期的真賺錢的區域?
1、高波動性背後:板塊過度承載機構資金
從上週以來,以新能源、光伏兩個高景氣度賽道的個股迎來調整,近幾個交易日尤為明顯,數板行情:不是漲停便是跌停。調整的開始,簡單的理解是獲利資金的出局。
而高波的背後,成長股5月到8月簡單選擇題已經結束了。一方面,從消費和醫藥資金出來的熱錢,只是給了個股短期上衝的動能,造成的是板塊過度聚集溢出效應。在最火爆的期間,兩個板塊全天的成交量就達到了全市場的30%左右,比如光伏,原本只能夠承載200-300億。
隨着短期機構資金的湧入,成交量被放大,一旦遇到調整,那麼這些完全不具有光伏、新能源研究體系的資金成為跟隨搶跑積極分子。
另一方面,創業板、科創板指數的壓制性。在上週四宣佈北交所成立到週末各項規章規則和未來的定位,管理層闡述非常明確也效率頗高。那麼,短期給兩個高彈性指數的壓制落地,在今天,大權重寧德時代企穩漲超6%,直接帶動了創業板指數漲超4%,反包了三根陰線。
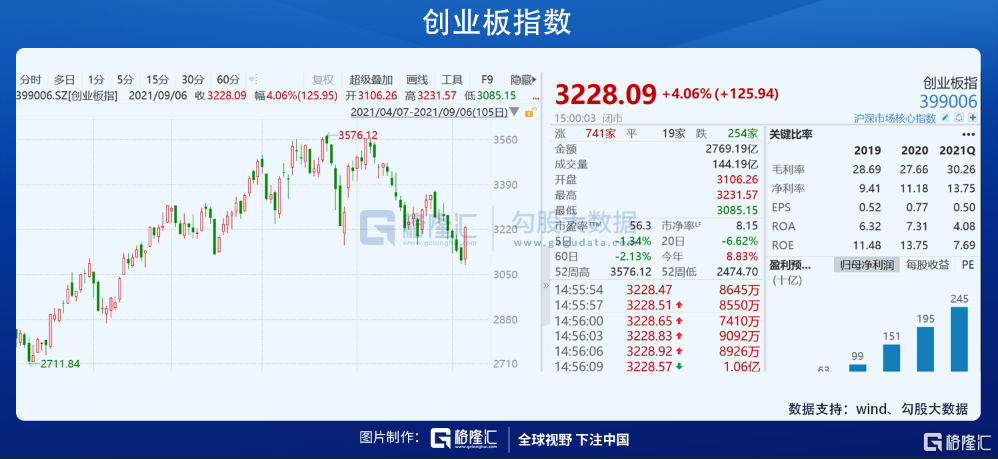
成交量上萬億,龍頭權重的企穩,也是意味着新能源、光伏的短期結束。高景氣度的投資,整體環境的寬鬆的環境必不可少。
在短中期,外圍傳導的寬鬆環境還將持續,在上週美國公佈最新的經濟數據,就業數據:其中新增非農就業人數為23.5萬人,顯著低於前值105.3萬人;失業率5.2%,降至疫後最低水平,前值5.4%;勞動參與率61.7%,與前值持平;時薪同比高達4.3%。
從數據來看,美國當前的疫情反彈干擾就業節奏和經濟的復甦進程,美聯儲也是從國內的情況出發,中期並不會收縮目前的貨幣規模,儘管從長期而言,緊縮控制超發的貨幣的策略這是長期,但是什麼時候能夠到來,都要卻決於自身經濟的復甦狀況。
所以,整體的宏觀環境並沒有給全球市場帶來一定的衝擊,那麼國內成長股的調整僅僅是盤面的因素,尤其是其他領域過來炒作的資金,造成的過度溢出。
在情緒,時間利空出清之後,哪些個股會迎來回歸呢?
首先,這次的高波震盪,依舊是圍繞景氣度去做文章,然後出現小眾股的大漲,權重個股的調整。那麼中長期具備高成長預期以及具備估值、短期有業績優勢的個股依舊會強於市場的表現,比如鋰礦、磷礦還是細分材料端的龍頭股。其次,光伏、新能源不受到上游材料漲價壓制利潤的設備端。
2、價值股是不是真迴歸?
機構的資金總是聰明的,也有自己的專屬行業研究,當一個行業的估值到了性價比之時,必然會被動性指數的配置。而在今天,除開高景氣賽道的龍頭企穩大漲之外,價值股也開始迎來回歸,甚至其中個股慢慢被資金髮現。
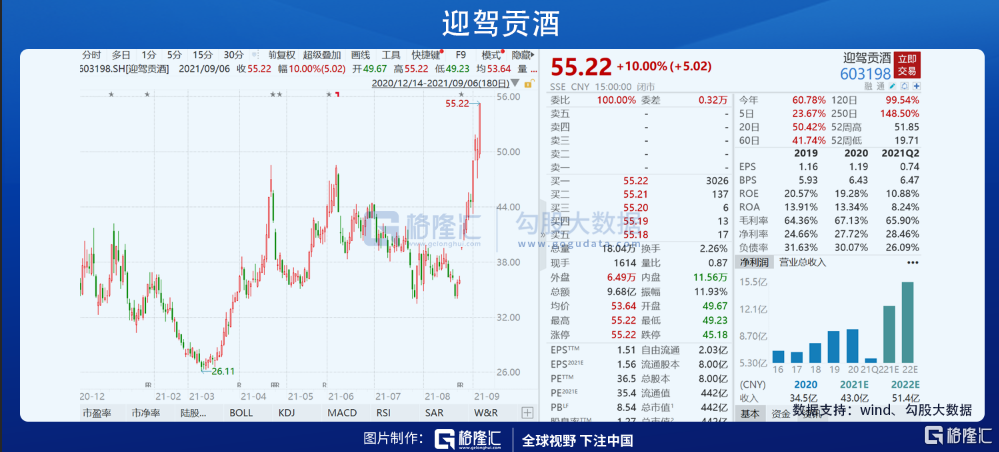
白酒板塊的迎駕貢酒創新高:
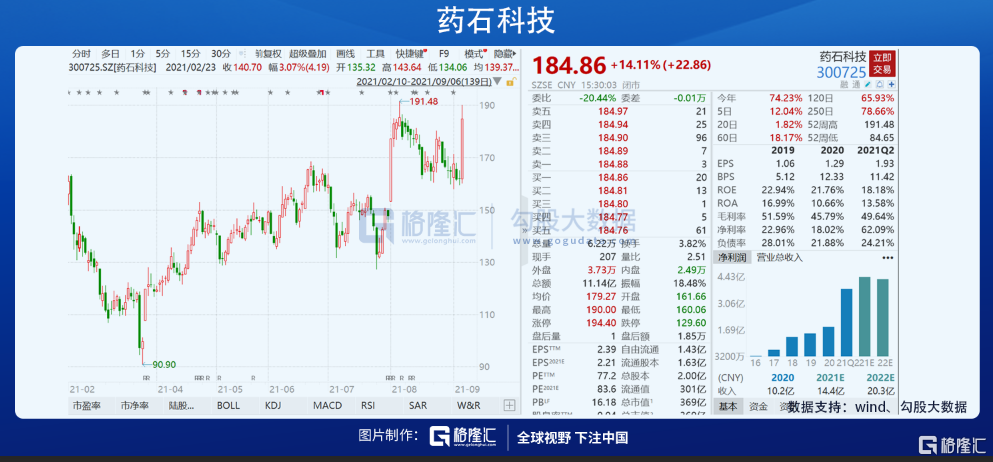
CRO的藥石科技大漲超14%:
而其他的大金融、地產股代表的上證50個股,並不是真正迎來價值的迴歸,主要在於政策的風險口並未出清,但是白酒和醫藥兩大版塊的估值性價比明顯。主要在於,這兩個領域的資金均是大機構扎堆的區域,資金的屬性並不會太雜,即便離開去炒賽道股,在調整迴流,也有足夠的利潤墊和熟人。
畢竟,白馬股畢竟有着穩健的基本面,比如前期在解析盤面説道的藥石科技,在今天收盤後,股價差不多摸到前高。
在最新的業績顯示,2021年上半年營業收入約6.21億元;歸屬於上市公司股東的淨利潤約3.81億元,同比增加336.52%,主營業務為藥物分子砌塊研發,佔營收比例為100%,當前的市值369億元。
小結:
從近期的盤面來看,高景氣的賽道股依舊會走,但是不會出現“雞犬升天”的行情,有着強邏輯和高爆發業績會走出來,而價值股,目前也僅僅是白酒、醫藥兩大板塊能夠得到機構的關注並回流資金去做多。
長期而言,簡單的選擇題會變得越來越難,考驗的不僅僅是投資者自身的分析能力,還有如何擇時?


More Content


