超長期來看,黃金價格現在到底貴不貴?
本文來自格隆匯專欄:財主家的餘糧,作者:財主家沒有餘糧啦
如果純粹地觀察名義美元價格,黃金價格目前算是有史以來的最高水平。
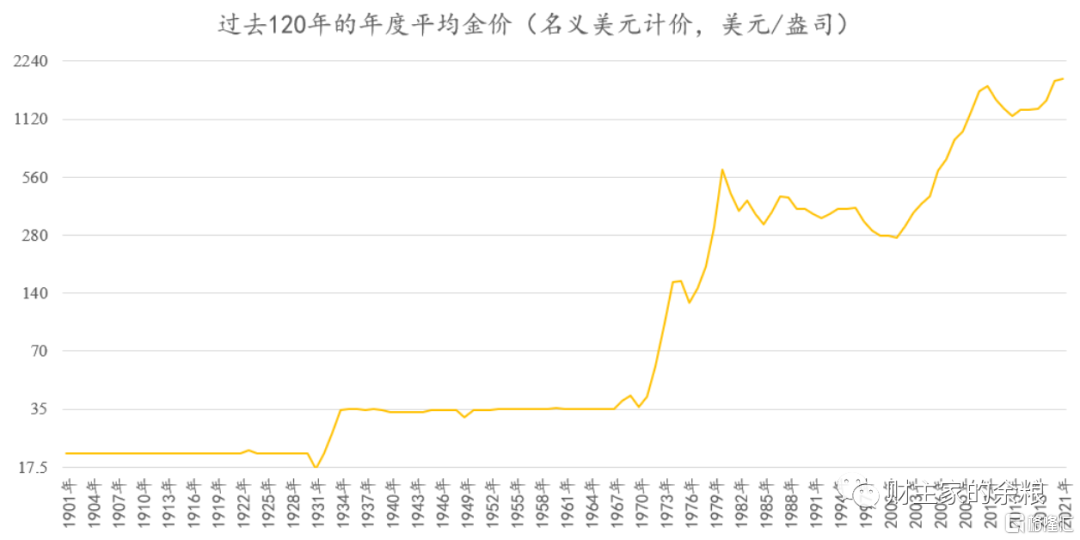
然而,如果考慮到過去100年持續的通貨膨脹、經濟發展以及信用貨幣超發等因素,當前的黃金價格,肯定不是歷史最高水平。
不是歷史最高水平,那是個什麼水平呢?
本文中,我採用美國的官方通脹率代表通貨膨脹水平,採用美國的GDP規模代表經濟發展水平,採用美元M2數量代表信用貨幣超發,對歷史上的黃金價格進行除權,進而從這3個角度,來觀察當前的黃金價格在極長期的歷史上,到底處於一個什麼樣的水平。
先來看經官方通脹率調整之後的除權金價。
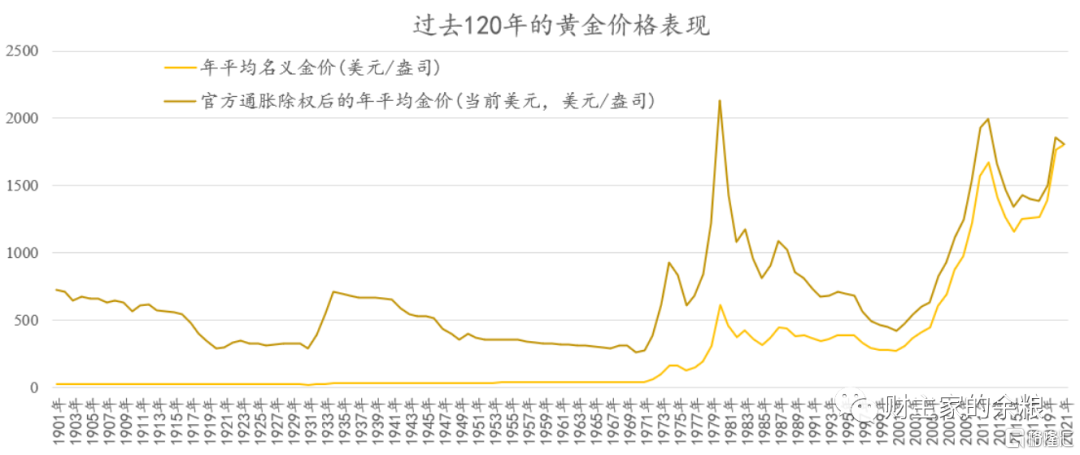
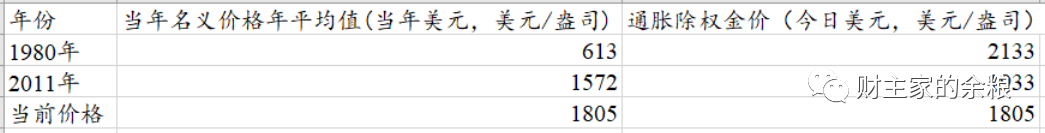
如果按照美國的官方通脹率數據,目前的金價雖然不是歷史最高,但也接近1980年的除權歷史最高價和2011年的歷史次高價。
我簡單列個表格。
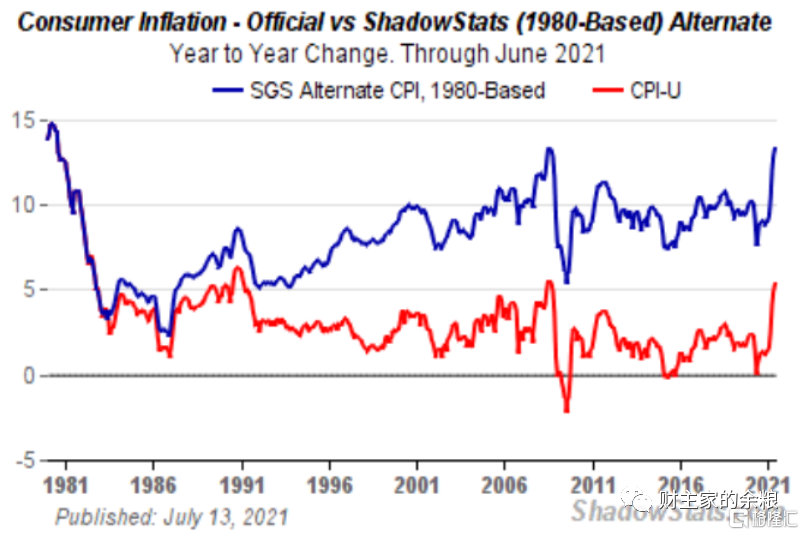
不過,在以往文章中,我已多次講過,美國的CPI統計方法,自1980年以來,經過美國官方多次調整,已經嚴重扭曲了真實的通脹水平。
例如,最近美國官方公佈的2021年6月份通脹率為5.4%,但是,根據影子統計網站採用1980年的方法,估算出來的美國真實通脹率其實在13%以上。
接下來,我們從美國經濟規模增長的角度,用GDP對歷史金價進行除權,從1930年算起,具體的情況見下圖。
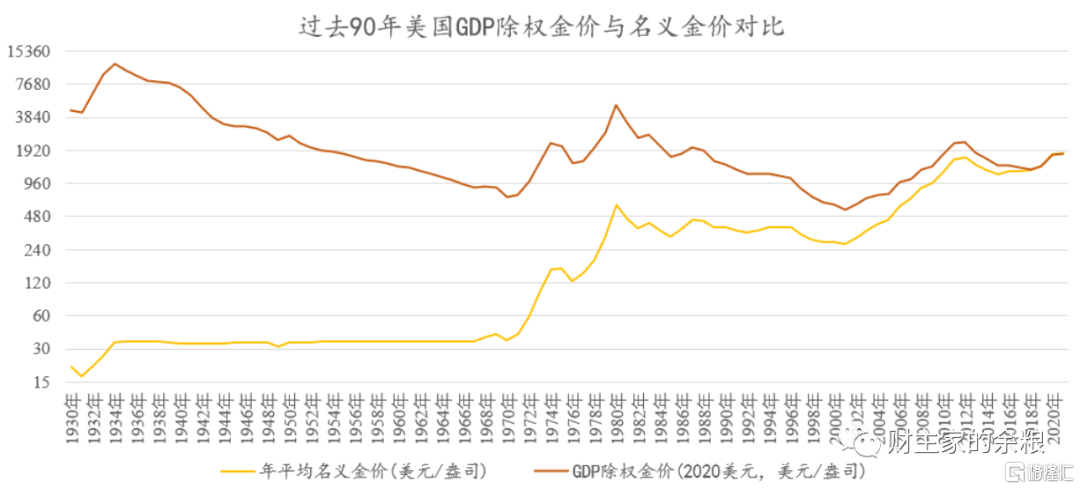
如果用GDP規模對歷史金價進行除權,金價歷史最高點並不是1980年,而是出現在大蕭條之中的1934年,按照如今的美元價值算,那一年的除權金價高達1.17萬美元/盎司。
進一步地,若按照GDP除權,1932年-1941年的連續10年時間,黃金價格都在6000美元以上,而1980年的除權金價,則是4993美元。
為什麼會出現這種情況?
就像CPI的統計方法變更一樣,這與GDP的統計方式變更有關。
用GDP統計經濟規模,雖然在1931年就被庫茲涅茨發明,但當代的GDP統計體系,卻是在二戰之後才確立的,而且在1970年代經過一次非常大的修改,把服務業、金融業之類的活動,都給折算到GDP中來。
這樣一來,以前的GDP數字就會顯得“太實在”,並由此造成除權金價整體被高估。
接下來,用美元M2來除權金價,限定到1968年開始——因為有了細顆粒度的月度數據,所以金價我們也採用月度數據,這樣就可以看出更細微的除權金價變化。
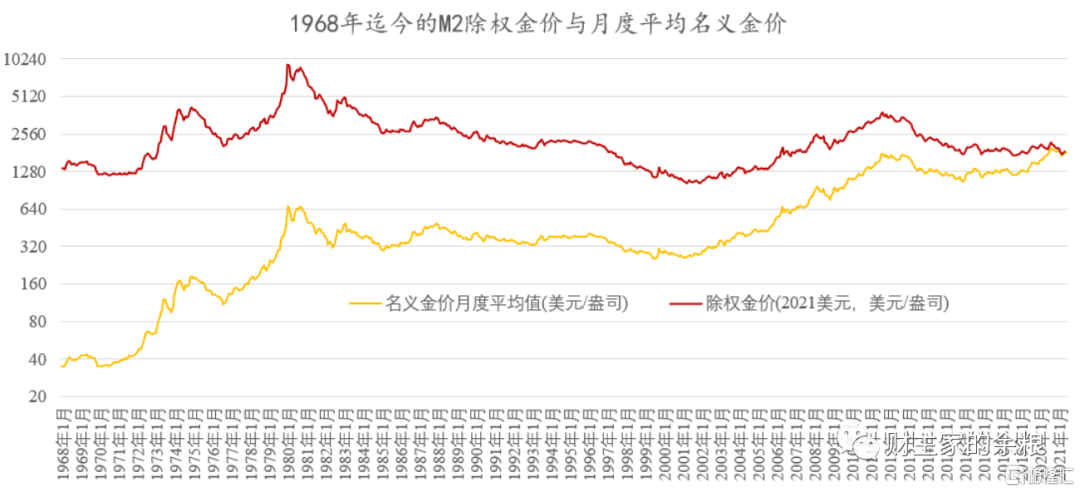
美元M2,基本上代表着流通的廣義貨幣數量,所以M2除權金價,在超過50年的極長期裏判斷金價貴不貴,我覺得是一個相當靠譜的指標。
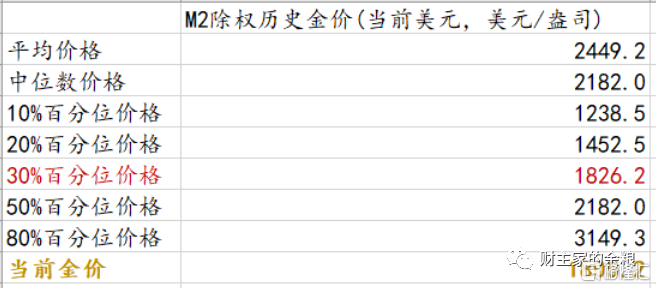
下面的表格,就是當前的黃金價格與過去50多年的M2除權金價的整體對比情況。
Follow us
Find us on
Facebook,
Twitter ,
Instagram, and
YouTube or frequent updates on all things investing.Have a financial topic you would like to discuss? Head over to the
uSMART Community to share your thoughts and insights about the market! Click the picture below to download and explore uSMART app!

Disclaimers
uSmart Securities Limited (“uSmart”) is based on its internal research and public third party information in preparation of this article. Although uSmart uses its best endeavours to ensure the content of this article is accurate, uSmart does not guarantee the accuracy, timeliness or completeness of the information of this article and is not responsible for any views/opinions/comments in this article. Opinions, forecasts and estimations reflect uSmart’s assessment as of the date of this article and are subject to change. uSmart has no obligation to notify you or anyone of any such changes. You must make independent analysis and judgment on any matters involved in this article. uSmart and any directors, officers, employees or agents of uSmart will not be liable for any loss or damage suffered by any person in reliance on any representation or omission in the content of this article. The content of the article is for reference only and does not constitute any offer, solicitation, recommendation, opinion or guarantee of any securities, virtual assets, financial products or instruments. Regulatory authorities may restrict the trading of virtual asset-related ETFs to only investors who meet specified requirements. Any calculations or images in the article are for illustrative purposes only.
Investment involves risks and the value and income from securities may rise or fall. Past performance is not indicative of future performance. Please carefully consider your personal risk tolerance, and consult independent professional advice if necessary.


