You are browsing the Hong Kong website, Regulated by Hong Kong SFC (CE number: BJA907). Investment is risky and you must be cautious when entering the market.
為什麼海底撈連續大漲?
格隆匯 07-08 09:48

作者 | 冥王星

數據支持 | 勾股大數據(www.gogudata.com)

今年大崩盤的海底撈最近連連上漲,629日大漲8.69%76日又大漲4個點,發生了什麼?

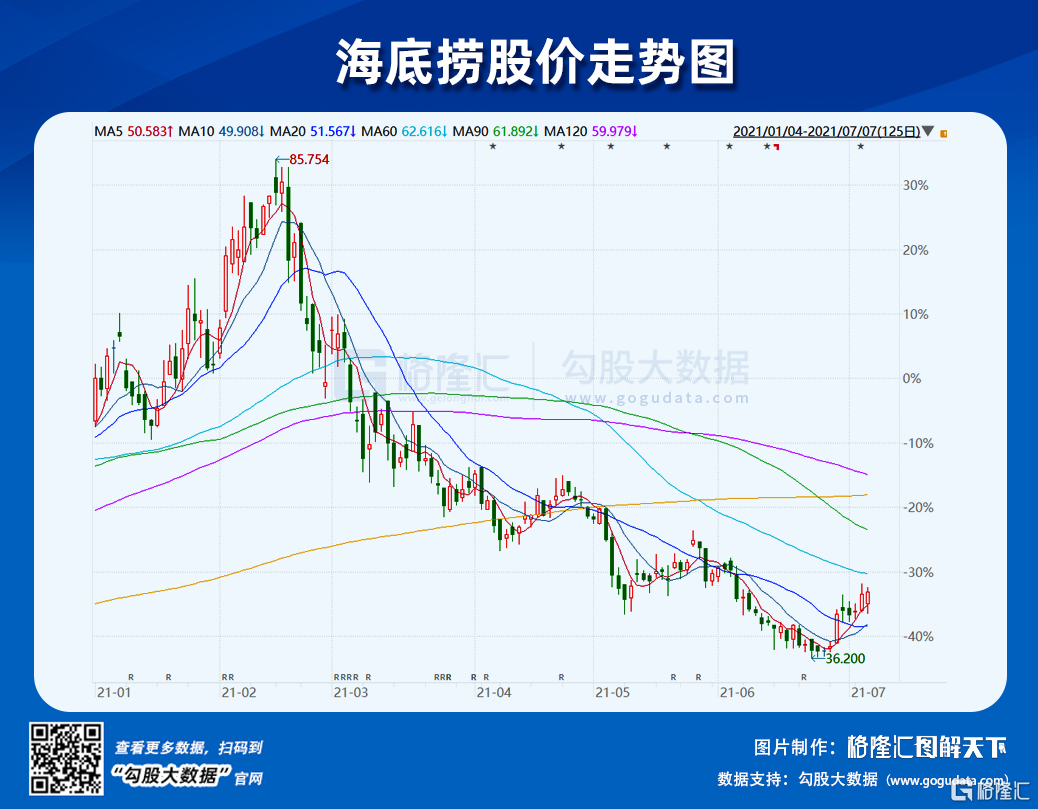
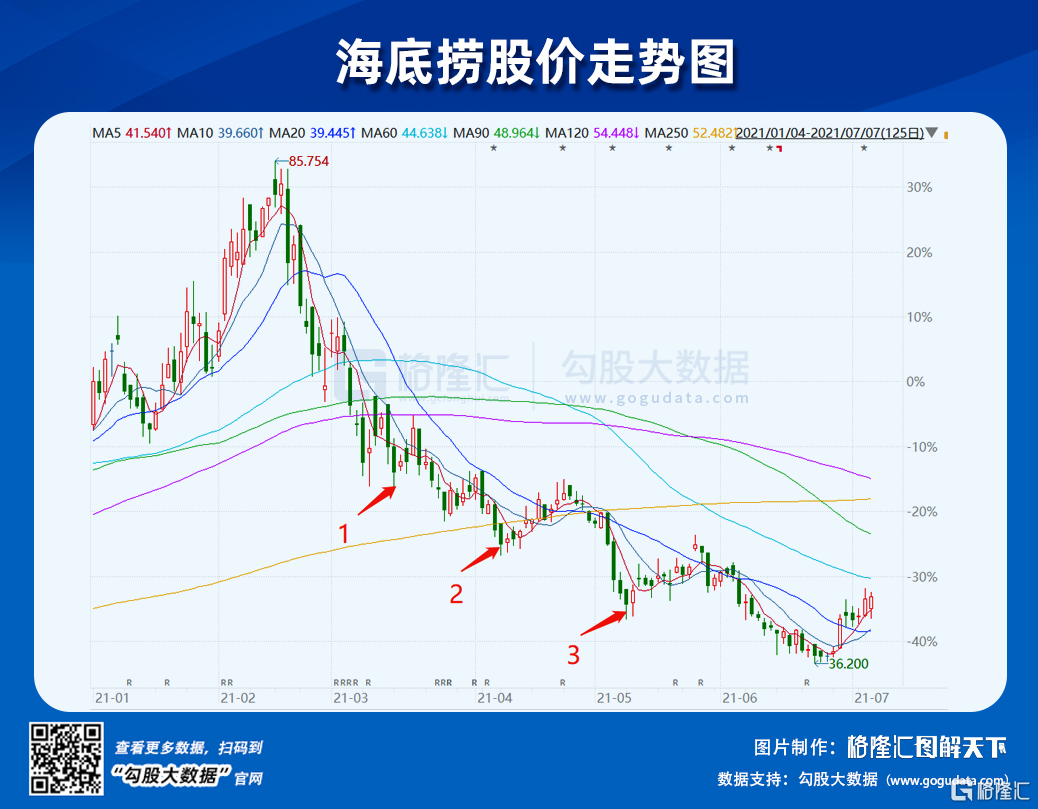
海底撈年初至今股價走勢(來源:WIND)

其實我們在6月30日的文章《什麼時候抄底海底撈》中已經提醒,6月26-27這個週末海底撈的翻枱率還可以,有略微回升的跡象。6月26日我們的數據顯示,海底撈的平均翻枱率是4.36,這比上個週末的最高4.34有回升。

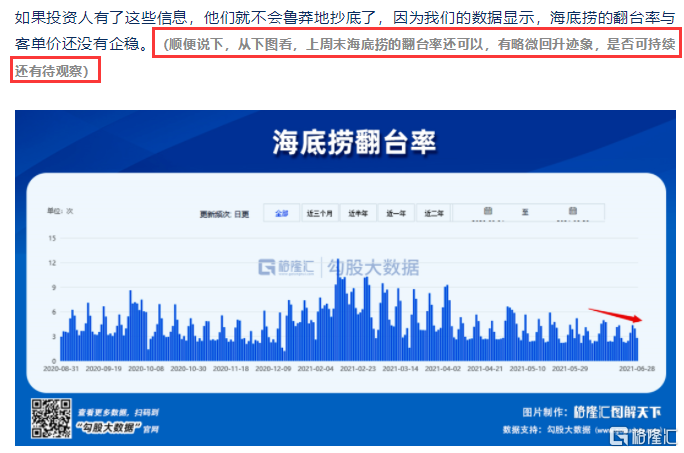
當然,這只是一次非常細微的回升,我們當時也提醒了,是否可持續有待觀察。而從上週的數據來看,海底撈不僅週末的翻枱率持續上升,7月4日達到了4.53,而且工作日也有明顯回暖跡象。

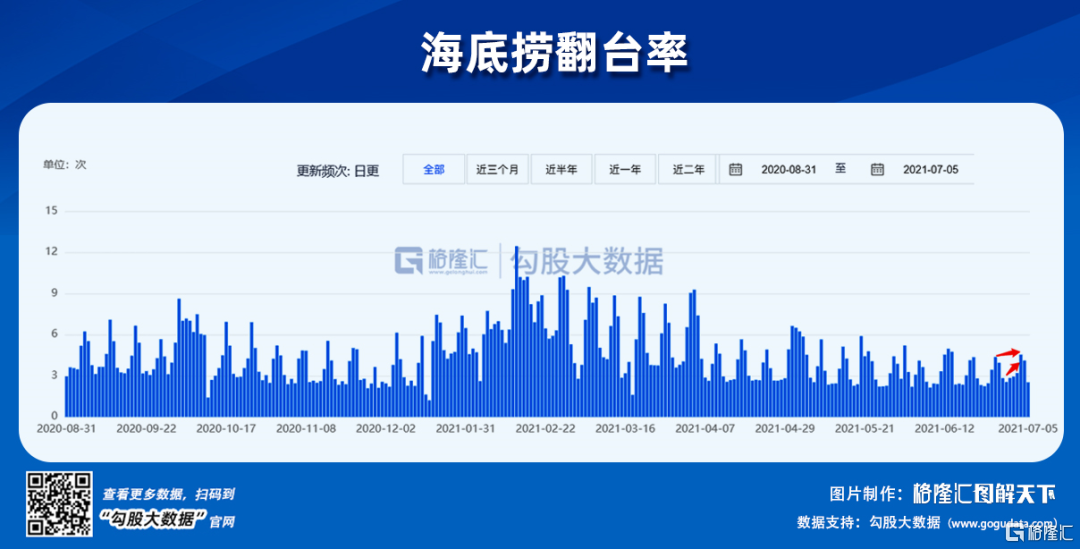
這些數據在表明,海底撈的門店平均來説,可能正在觸底反彈,這是一個好跡象。

當然,必須得指出,我們的數據顯示,海底撈的平均客單價還在回落,雖然回落速度在放緩。

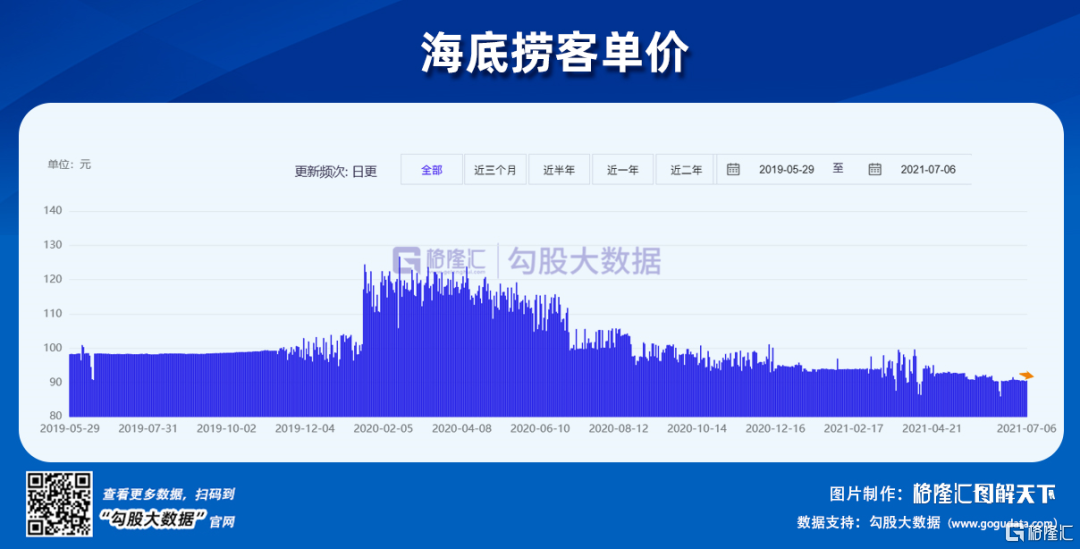
所以,最近的翻枱率上升,究竟是不是促銷導致,是否擁有可持續性,需要繼續觀察。如果我們觀察到翻枱率回升,同時客單價企穩甚至回升,那我們就可以更有把握一些。

我們提醒一下投資朋友,底部抄底,要做好大波動的準備,不建議一次性一把梭,可以在最初看到好轉跡象的時候,買點底倉,後面隨着數據的向好,確定性在變大,再逐步加倉。

如何追蹤海底撈門店的基本情況呢?

很簡單,關注我們勾股大數據,我們提供日更的海底撈門店、客單價、翻枱率數據,這三個數據就是海底撈的三個最關鍵指標。掌握了這三個數據,海底撈的經營情況也基本一清二楚了。

你不需要去賭“別人恐慌我貪婪”,因為大多數的貪婪最後都是抄半山腰。巴菲特説這句話,沒有説的東西是,你必須對你抄底的對象瞭解清楚。海底撈上也如是,有的人可能抄在了1,有的人可能抄在了2,還有的人可能抄在了3,不同的成本,會形成不同的心理承受力。

可能有人説,我就是衝長期去的,但每當筆者聽到這番話的時候,筆者就笑而不語,以筆者多年的經驗,少有人可以在成本不佔優的時候,還能在驚濤駭浪的市場中保持淡定。

抄到合理的位置,並掌控關鍵的數據來不斷驗證我們的抄底邏輯,才是我們最終能夠完成一次漂亮抄底的根本保證。

這就是為什麼你需要海底撈的這些數據。

勾股大數據海底撈門店數量、客單價、翻枱率指標按日更新、全面、實時反應海底撈經營狀況。購買海底撈股票的投資者關注這幾個指標,實時瞭解企業經營狀況,手握底牌,持股不慌。現在購買僅需5折,以上活動截止至2021-07-15

購買路徑

1.https://gogudata.com/linglei/detail-demo?id=1&c=mp

2.關注“勾股大數據”公眾號->屏幕下方欄目->官方網站->另類數據->海底撈

3.點擊左下角“閲讀原文“

【福利】前100名購買海底撈指標的朋友額外獲得2個月格隆匯SVIP會員(5898元/年),享受SVIP會員的5大專屬權益,捕獲更多潛在翻倍機會。

① 實時解盤:專為SVIP會員打造的盤中討論區;

② 時事提醒:研究員視角整合市場信息,每晚推送當日重點消息;

③ 四大投研欄目:公司深研、行業深研、市場觀點、集結令;

④ 行業龍頭:和頭部公司共同成長,挖掘中長期投資機會;

⑤ 格隆精選:解鎖格隆博士全部精選文章合集,及隨時撰寫的感悟、思考和提醒。

如需更深層次數據定製、數據報吿或者有任何疑問,歡迎掃碼添加勾股大數據客服交流。

勾股大數據聲明:本文僅基於客觀數據的分析預測,投資決策需建立在獨立思考之上,本文內容僅供參考,不作為實際操作建議,交易風險自擔

點擊閲讀原文為投資賦能

Follow us
Find us on Facebook, Twitter , Instagram, and YouTube or frequent updates on all things investing.Have a financial topic you would like to discuss? Head over to the uSMART Community to share your thoughts and insights about the market! Click the picture below to download and explore uSMART app!
Disclaimers
uSmart Securities Limited (“uSmart”) is based on its internal research and public third party information in preparation of this article. Although uSmart uses its best endeavours to ensure the content of this article is accurate, uSmart does not guarantee the accuracy, timeliness or completeness of the information of this article and is not responsible for any views/opinions/comments in this article. Opinions, forecasts and estimations reflect uSmart’s assessment as of the date of this article and are subject to change. uSmart has no obligation to notify you or anyone of any such changes. You must make independent analysis and judgment on any matters involved in this article. uSmart and any directors, officers, employees or agents of uSmart will not be liable for any loss or damage suffered by any person in reliance on any representation or omission in the content of this article. The content of the article is for reference only and does not constitute any offer, solicitation, recommendation, opinion or guarantee of any securities, virtual assets, financial products or instruments. Regulatory authorities may restrict the trading of virtual asset-related ETFs to only investors who meet specified requirements. Any calculations or images in the article are for illustrative purposes only.
Investment involves risks and the value and income from securities may rise or fall. Past performance is not indicative of future performance. Please carefully consider your personal risk tolerance, and consult independent professional advice if necessary.
uSMART
Wealth Growth Made Easy
Open Account