銀行股三龍頭一季報怎麼看?
本文來自:志明看金融,作者:廖志明
招行、平安、寧波銀行皆為A股銀行股一線龍頭,近期已披露一季報,業績非常靚麗,息差平穩或上升,資產質量優異且進一步改善。招行和寧波銀行ROE長期領跑上市銀行,平安銀行則見底回升。三者皆大幅發力財富管理,招行為財富管理領域領頭羊,平安快速崛起,寧波銀行起步雖晚但增長快。
盈利增速大幅上升,ROE回升
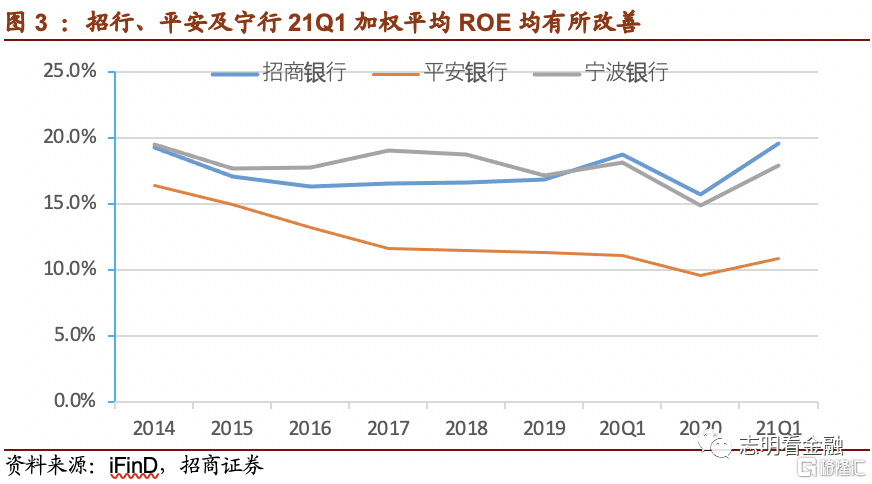
盈利增速大幅上升。經濟明顯復甦之下,疫情影響接近完全消退,1Q21營收增速向好,除平安21Q1營收增速較20年微降外,招行及寧行皆上升。營收增長較快系息差平穩資產規模擴張較快,21Q1招行/平安/寧行資產規模同比增速為12.7%/13.4%/23.5%。21Q1招行/平安/寧行盈利增速為15.2%/18.5%/18.3%,均較20年大幅上升。由於20年一季度盈利增速較高及後續走低,基於基數及實質基本面改善,我們預計1Q21為2021年內盈利增速相對低點,後續將進一步上升。
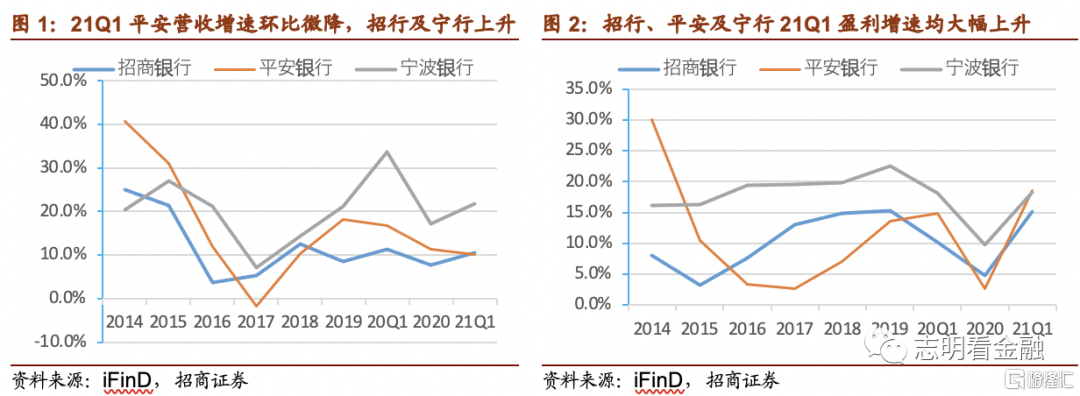
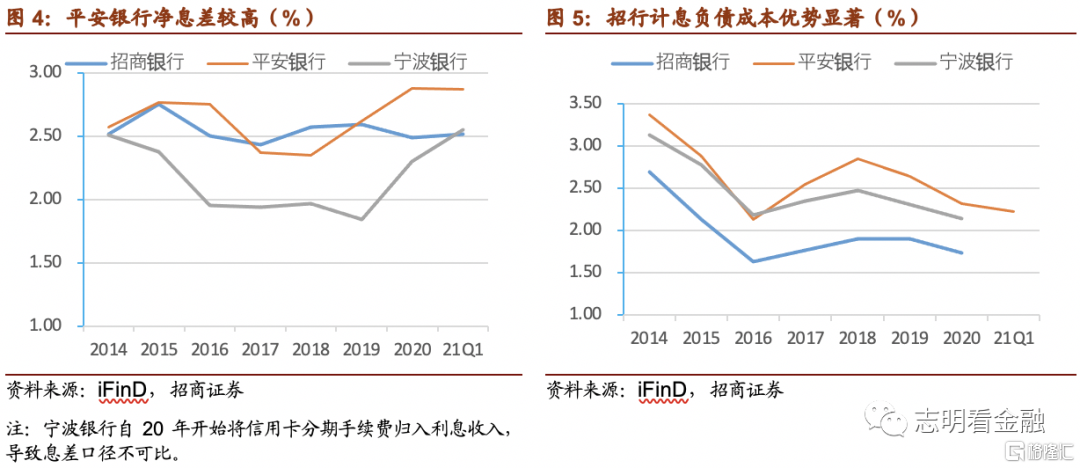
ROE回升。得益於盈利大幅增長,加權平均ROE均有所改善。21Q1招行加權平均ROE為三者最高,達19.5%;寧波次之,為17.9%;平安最低為10.9%。
息差平穩或上升,招行負債成本優勢顯著
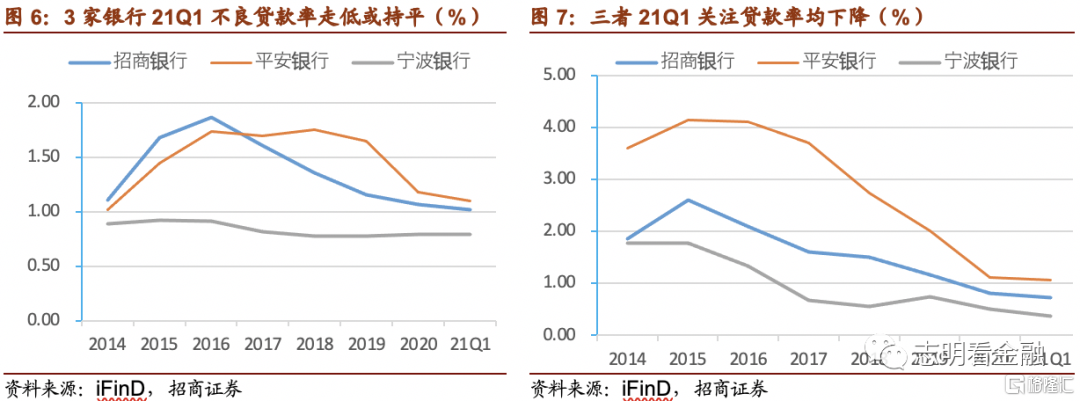
息差平穩或上升。21Q1招行/平安/寧行淨息差為2.52%/2.87%/2.55%,招行和平安息差與20年基本相當,寧波則上升25BP,改善明顯。作為銀行股三龍頭,三者淨息差均為銀行板塊領先水平,優勢顯著;且21Q1息差走勢好於市場預期。
招行負債成本優勢顯著。2020年招行/平安/寧行計息負債成本率為1.73%/2.32%/2.14%,招行負債成本優勢最顯著,平安為三者中最高者。不過,平安銀行計息負債成本率自2018年以來下降明顯,與優勢銀行差距明顯縮小。
資產質量優異,且進一步改善
資產質量優異。招行/平安/寧行21Q1不良貸款率為1.02%/1.10%/0.79%,環比下降5/8/0BP;關注貸款率為0.73%/1.06%/0.36%,環比下降8/5/14BP,三者資產質量皆優異,且進一步改善。這説明疫情影響基本結束,經濟明顯復甦之下,銀行資產質量呈現穩中向好之態勢。
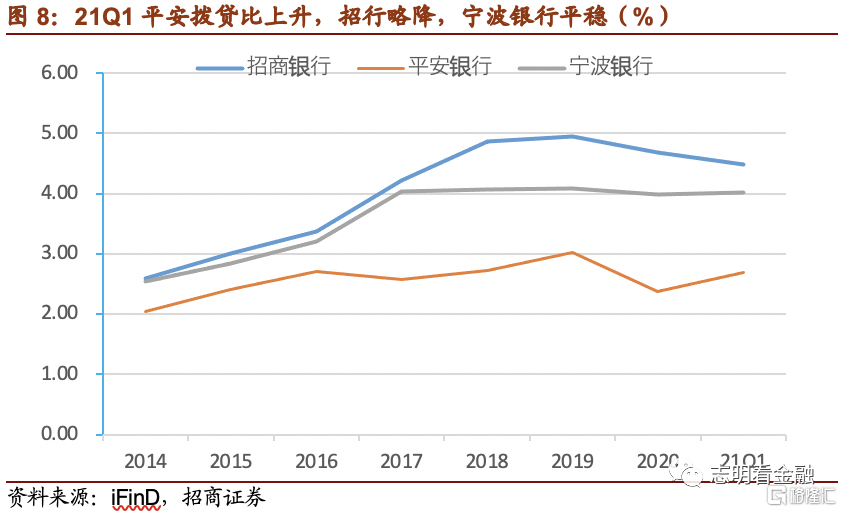
 撥備較充裕。截至2021年 3月末,招行撥貸比4.48%,為三者中最高水平;寧波銀行為4.02%,平安銀行則為2.70%。招行和寧行撥備水平較高,21Q1保持平穩,平安撥貸比提升。
招行手續費及佣金淨收入領跑,平安零售AUM快速增長
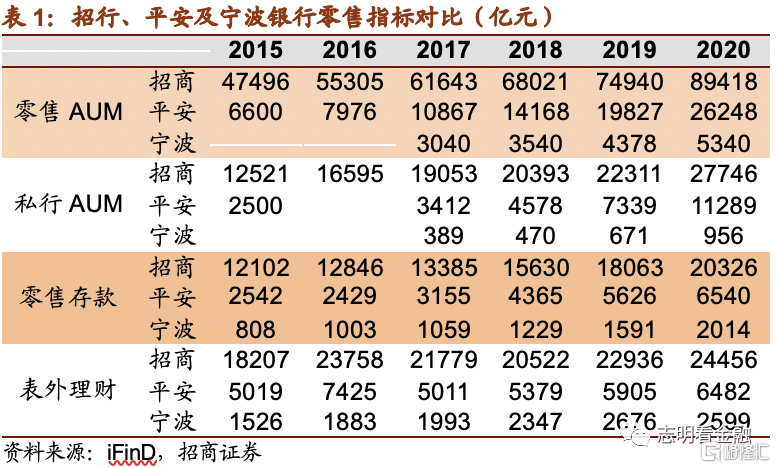
財富管理大發力,平安銀行發展最快。截至2020年末,招行零售AUM達8.9萬億,為絕對的領頭羊,平安次之,為2.6萬億,寧波銀行則為0.5萬億元。從增速來看,截至2020年末,平安銀行零售AUM較2015年末增加了3.0倍,同期招行零售AUM增加了0.9倍,平安銀行發展迅速。2020年末平安銀行零售AUM同比增速達32.4%,招行及寧波則為20%左右。
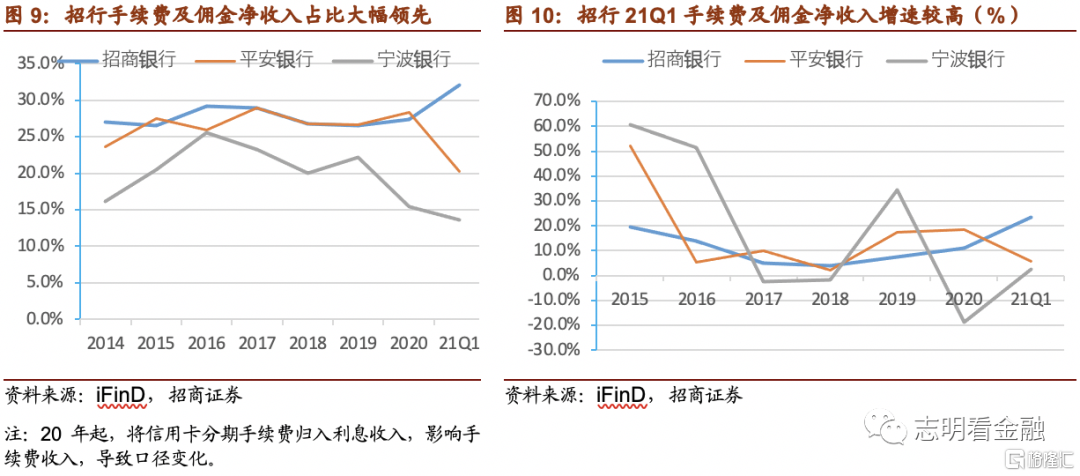
得益於財富管理等貢獻,招行手續費及佣金淨收入佔比大幅領先。招行21Q1手續費及佣金淨收入達272億元,佔比達32.1%,遙遙領先。平安銀行21Q1手續費及佣金淨收入84.8億元,同口徑同比增速5.7%;寧波銀行為17.9億元,同口徑同比增速2.4%,增速較慢。
一季報業績催化,銀行板塊有望迎來新一輪估值修復
招行、平安、寧波銀行皆為A股銀行股一線龍頭,一季報業績非常靚麗,盈利增速大幅回升,息差平穩或上升,資產質量優異且進一步改善。招行和寧波銀行ROE長期領跑上市銀行,平安銀行則見底回升。展望全年,預計一季度為盈利增速相對低點,後續有望進一步走高。經濟明顯復甦,靚麗的一季報業績有望催化銀行板塊開啟新一輪估值修復行情。
當前位置,我們力推平安銀行及興業銀行,關注區域好、公司治理完善、戰略清晰、管理層能力較強且估值較低的長沙、成都、南京、常熟等。平安銀行依託集團及科技賦能,財富管理大發展,已崛起為零售銀行標杆,估值有望明顯提升,當前性價比凸顯。興業銀行財富銀行戰略清晰,零售AUM增長較快,市場化程度較高,近期因管理層可能的變化股價回調明顯,帶來低估值配置機會。
Follow us
Find us on
Facebook,
Twitter ,
Instagram, and
YouTube or frequent updates on all things investing.Have a financial topic you would like to discuss? Head over to the
uSMART Community to share your thoughts and insights about the market! Click the picture below to download and explore uSMART app!

Disclaimers
uSmart Securities Limited (“uSmart”) is based on its internal research and public third party information in preparation of this article. Although uSmart uses its best endeavours to ensure the content of this article is accurate, uSmart does not guarantee the accuracy, timeliness or completeness of the information of this article and is not responsible for any views/opinions/comments in this article. Opinions, forecasts and estimations reflect uSmart’s assessment as of the date of this article and are subject to change. uSmart has no obligation to notify you or anyone of any such changes. You must make independent analysis and judgment on any matters involved in this article. uSmart and any directors, officers, employees or agents of uSmart will not be liable for any loss or damage suffered by any person in reliance on any representation or omission in the content of this article. The content of the article is for reference only and does not constitute any offer, solicitation, recommendation, opinion or guarantee of any securities, virtual assets, financial products or instruments. Regulatory authorities may restrict the trading of virtual asset-related ETFs to only investors who meet specified requirements. Any calculations or images in the article are for illustrative purposes only.
Investment involves risks and the value and income from securities may rise or fall. Past performance is not indicative of future performance. Please carefully consider your personal risk tolerance, and consult independent professional advice if necessary.


