康龍化成飆漲11%,泰格醫藥、藥明康德漲超7%!CRO行業究竟發生了什麼?
今日,醫藥生物板塊市場表現火熱,醫療ETF大漲4%,其中CRO板塊最為亮眼,康龍化成漲近11%,昭衍新藥一字板封漲,泰格醫藥、美迪西、藥石科技、藥明康德均漲超7%。同時,港股康龍化成漲近10%,藥明康德大漲5%。
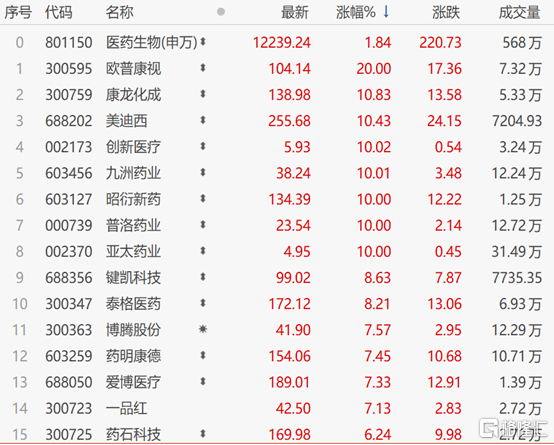
(來源:Choice數據)
CRO行業集體爆發的背後,是市場對其業績預期向好的表現,目前已有多家CRO公司披露2020年業績預吿超預期。
昨日,昭衍新藥發佈2020年年度業績預吿,預計全年實現歸母淨利潤約3.03億元-3.22億元之間,同比增加69.9%-80.3%;扣非後歸母淨利潤約1.2億元-1.387億元,同比增加77.5%-89.6%,其中Q4單季度同比增長86.7%-106.4%,超於市場預期。
對於業績增長的原因,一方面受政策推動影響,國內創新藥市場增長高景氣,2020年IND受理品種數量同比增長32%以上,公司2020年新簽訂單保持高速增長;另一方面,隨着公司2019年中期1.08萬平新動物房投產,隨着公司產能釋放和新簽訂單高速增長,規模化效應凸顯。同時,昭衍新藥2019年底併購美國安評機構Biomere,並表後增厚業績。
此前,國內臨牀前一站式CRO細分市場龍頭之一的美迪西亦公佈其業績預吿,預計2020年扣非淨利潤為1.17-1.26億元,同比增長100%-115%。其中Q4單季度扣非淨利潤同比增長235.8%。
可以看到,CRO相關公司業績表現向好,彰顯行業高景氣,帶動了市場對於泰格醫藥、康龍化學、藥明康德的業績預期上升。
除此之外,2020年新冠疫情帶動生物醫藥研發需求快速增長,全球醫療健康產業投融資同比增長41%,國內同比增長58%,雙雙創歷史新高,由此引發對於疫情加速全球創新藥產業鏈轉移預期提高。
從行業發展來看,隨着人口老齡化不斷加劇、患者醫藥需求日益增加,疊加醫藥行業剛需特性,全球醫藥市場保持穩定增速增長態勢,華安證券預計到2020年全球醫藥支出將達到1.4萬億美元,比2015年增長29-32%。中國醫藥市場規模從2015年的12207億元增長至2019年的16330億元,複合增長率為7.5%,2020年有望達到17147億元。
但在此背景下,傳統藥企面臨着超長的研發週期、大量資金需求、低成功率等問題。全球Top10製藥企業2017年研發回報率只有3.2%,第二梯隊的中小型藥企同年的新藥研發回報率為11.9%。
因此,專注於新藥研究的CRO公司孕育而生。不僅以高效贏得了大型藥企的業務訂單,還通過彌補小型藥企研發能力不足的優勢,擴大了CRO產業的服務範圍,目前超過50%的製藥企業都開始與CRO合作。
經過十多年的發展,CRO公司為代表的研發力量在藥物設計,組合化學,高通量篩選,製劑,藥動,安全性評價等平台建設進步明顯,已成為新藥研發的主力軍。
2014年全球醫藥研發投入約為1416億美元,2019年增長至1827億美元,Frost&Sullivan預計2023年增長至2168億美元,為CRO行業創造了巨大的發展空間。
從整體市場來看,全球CRO市場從2014年的401億元增長至2019年的626億美元,年複合增速為9.3%。而中國CRO市場複合增速遠超全球市場,中國CRO市場由2016年的28億美元增長至2019年的63億美元,年複合增速為28.5%。
預計到2023年全球的CRO規模將達到877億美元,中國的CRO市場規模將會達到172億美元,佔全球規模的約20%,年複合增速達28.54%(2019-2023年),維持在高位水平。
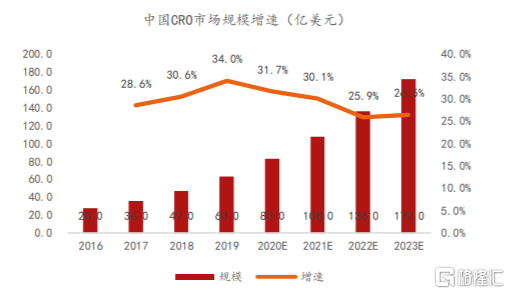
(中國CRO市場規模及預測,來源:國聯證券)
不過,由於國內市場起步較晚,目前仍以仿製藥為主,創新藥需要的藥物發現CRO市場需求較弱,整個CRO市場主要集中在臨牀CRO研究上,佔國內市場的70%以上。目前,臨牀CRO的代表公司有泰格醫藥、藥明康德、康龍化成等公司,可關注。
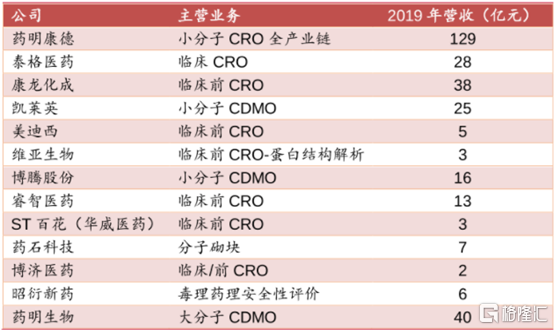
(CRO產業鏈上市公司盤點,來源:國聯證券)
Follow us
Find us on
Facebook,
Twitter ,
Instagram, and
YouTube or frequent updates on all things investing.Have a financial topic you would like to discuss? Head over to the
uSMART Community to share your thoughts and insights about the market! Click the picture below to download and explore uSMART app!

Disclaimers
uSmart Securities Limited (“uSmart”) is based on its internal research and public third party information in preparation of this article. Although uSmart uses its best endeavours to ensure the content of this article is accurate, uSmart does not guarantee the accuracy, timeliness or completeness of the information of this article and is not responsible for any views/opinions/comments in this article. Opinions, forecasts and estimations reflect uSmart’s assessment as of the date of this article and are subject to change. uSmart has no obligation to notify you or anyone of any such changes. You must make independent analysis and judgment on any matters involved in this article. uSmart and any directors, officers, employees or agents of uSmart will not be liable for any loss or damage suffered by any person in reliance on any representation or omission in the content of this article. The content of the article is for reference only and does not constitute any offer, solicitation, recommendation, opinion or guarantee of any securities, virtual assets, financial products or instruments. Regulatory authorities may restrict the trading of virtual asset-related ETFs to only investors who meet specified requirements. Any calculations or images in the article are for illustrative purposes only.
Investment involves risks and the value and income from securities may rise or fall. Past performance is not indicative of future performance. Please carefully consider your personal risk tolerance, and consult independent professional advice if necessary.


