兩百億外資昨天新進場,他們買了什麼?
來源:上海證券報
週五,滬指急漲六連陽之後開始調整,但北向資金卻一改此前的謹慎態度,全天大幅淨買入206.15億元,創歷史第二大單日淨買入額,僅次於2019年11月26日(當日淨買入214.30億元)。
兩百億外資昨天掃貨了什麼?從前30大重倉股數據來看,北向資金週五大筆買入海螺水泥、萬科A、萬華化學等週期龍頭品種。另一方面小市值標的數據顯示,北向資金也逢低介入了近期大熱的光伏概念。
調倉重倉股:
加倉海螺水泥 減持愛爾眼科
從北向資金前30大重倉股的增減持動向來看,兩百億外資昨日對週期龍頭個股的加倉動作十分明顯。
Wind數據顯示,北向資金昨日大幅增持海螺水泥近1800萬股,其單日持股數量增幅達4.76%。在此前的記錄中,北向資金對於個股單日持股量增長超過1%便已較為突出。此外,地產龍頭萬科A、化工龍頭萬華化學北向資金持股量增長同樣超過了2%。
值得注意的是,Wind數據顯示,目前海螺水泥的北向資金持股量處於歷史相對低位。自2020年1月開始,北向資金便持續減持海螺水泥,其持股量從最高逾5億股下滑至當前的3.95億股。北向資金對於海螺水泥的加倉是觸底回升還是短期反彈,還需時間來驗證。
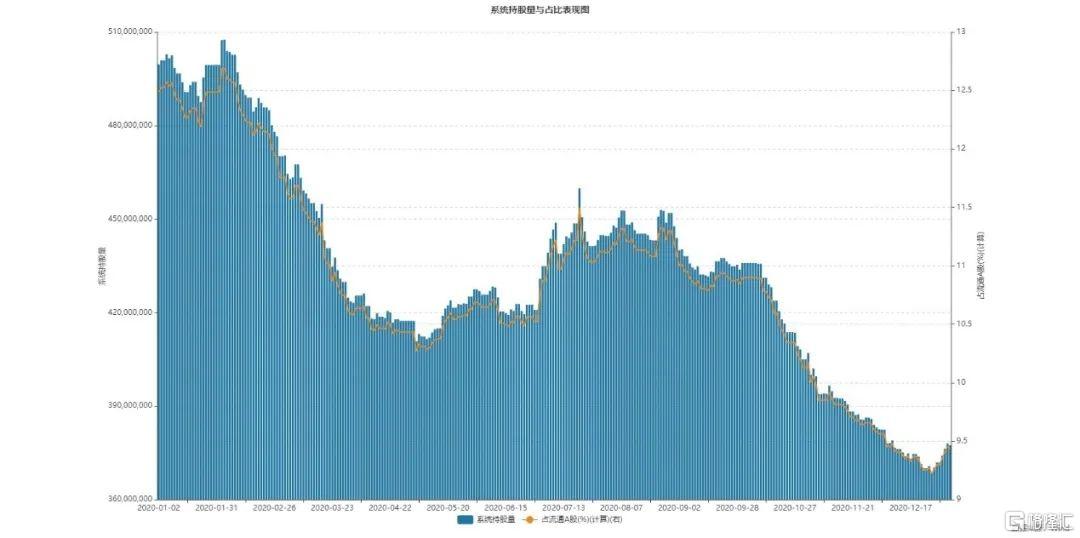
北向資金海螺水泥持股量變化圖
北向資金前30大重倉股中,唯一一隻遭北向資金減倉比例超1%的則是愛爾眼科,其北向資金持股量單日持股量下降了1.42%。此外,中國中免的北向資金持股量下降也接近1%,達0.93%,結合中國中免近期股價走勢來看,外資或是高位拋售中國中免。
逢低介入光伏概念
另一方面,從持股比例的角度來觀察其對小市值公司的持倉變動,可以發現北向資金昨日買入了不少光伏概念標的。
Wind數據顯示,昨日北向資金初股比例(佔流通A股)增幅最明顯的標的為光伏企業太陽能,其北向資金持股比例上上了1.23個百分點。東方日升、中材科技、贛鋒鋰業的北向資金持股比例也分別上升了0.79、0.57和0.47個百分點。
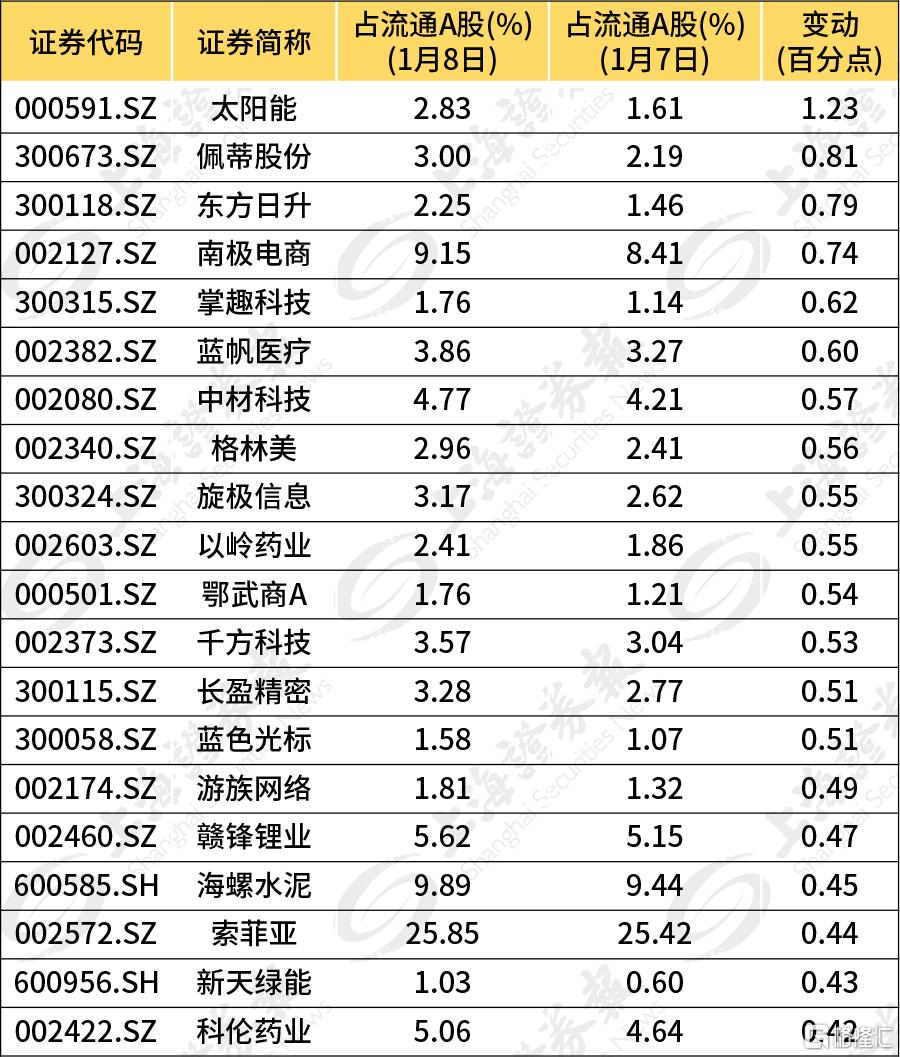
北向資金持股比例變化前20只
同時,北向資金加倉部分消費領域細分龍頭:如寵物經濟標的佩蒂股份,其北向資金持股比例單日上升0.81個百分點。掌趣科技、遊族網絡、藍色光標等遊戲傳媒領域個股的北向資金持股比例增幅也較前。
強勢掃貨後市如何?
Wind數據統計顯示,此前北向資金全天淨買入超過100億元的情況有23次,次日滬指漲幅為正的概率超過4成,後7日滬指漲幅為正的概率近7成。
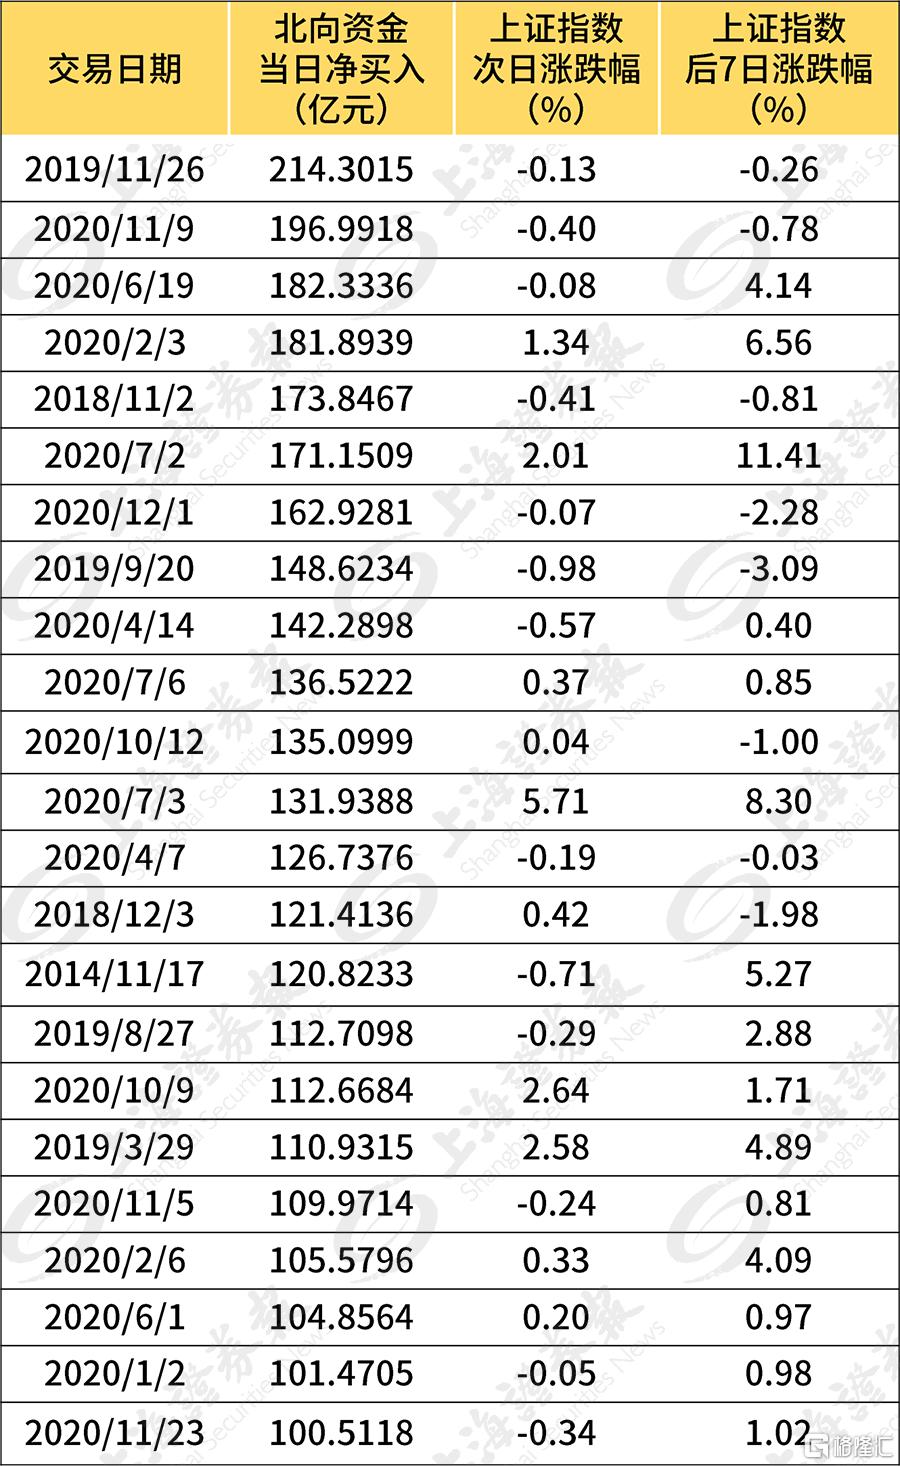
將時間軸拉長來看,北向資金憑藉其成熟的投資理念,2020年同樣在數個變盤節點成為先行指標。除了2020年2月3日的大舉抄底外,在包括3月初的指數階段頂部,以及7月份大漲啟動前期,北向資金的方向選擇都領先於指數變盤。
助推A股“春季躁動”行情
開源證券金工團隊不久前發佈研報,從量化角度研究了北向資金與A股的關係。研究表明,近年來北向資金對於A股市場的影響力日漸彰顯。特別是從2017年以來,北向淨買入金額對指數漲跌幅的解釋度逐漸增加。另外通過定性覆盤,還可以發現北向資金對A 股市場走勢具有一定的預判性。
同時,從歷史經驗來看,北向資金強勢掃貨,多次助推A股“春季躁動”行情。
粵開證券策略團隊分析認為,以月度為單位的北上淨流入額並非持續增長,每月變化幅度相差較大。通過統計過去6年的歷史情況,北向資金在近3年淨流入的大月大多集中在年初和年底兩頭,呈現春季躁動或翹尾情況。
粵開證券表示,通過回溯過去3年中A股頭年12月至次年2月的月均漲幅,上證指數/滬深300/創業板指的勝率分別達到67%/100%/67%,這與北向大幅淨流入的月份較為吻合。從指數全年的運行趨勢來看,這3個月的平均月漲跌幅大部分時間可以跑贏全年的月均漲跌幅,確實存在所謂的“春季躁動”行情。而北向資金在年初和年尾的大幅淨流入,對助推行情上行有積極影響。
Follow us
Find us on
Facebook,
Twitter ,
Instagram, and
YouTube or frequent updates on all things investing.Have a financial topic you would like to discuss? Head over to the
uSMART Community to share your thoughts and insights about the market! Click the picture below to download and explore uSMART app!

Disclaimers
uSmart Securities Limited (“uSmart”) is based on its internal research and public third party information in preparation of this article. Although uSmart uses its best endeavours to ensure the content of this article is accurate, uSmart does not guarantee the accuracy, timeliness or completeness of the information of this article and is not responsible for any views/opinions/comments in this article. Opinions, forecasts and estimations reflect uSmart’s assessment as of the date of this article and are subject to change. uSmart has no obligation to notify you or anyone of any such changes. You must make independent analysis and judgment on any matters involved in this article. uSmart and any directors, officers, employees or agents of uSmart will not be liable for any loss or damage suffered by any person in reliance on any representation or omission in the content of this article. The content of the article is for reference only and does not constitute any offer, solicitation, recommendation, opinion or guarantee of any securities, virtual assets, financial products or instruments. Regulatory authorities may restrict the trading of virtual asset-related ETFs to only investors who meet specified requirements. Any calculations or images in the article are for illustrative purposes only.
Investment involves risks and the value and income from securities may rise or fall. Past performance is not indicative of future performance. Please carefully consider your personal risk tolerance, and consult independent professional advice if necessary.


