白酒為何一直漲?
作者:汪友若
來源: 上海證券報
週四早盤,三大股指大幅高開後呈震盪走勢。截至午間收盤,上證指數報3306.19點,上漲0.88%;深證成指報13818.87點,上漲1.17%;創業板指報2764.46點,上漲0.51%。
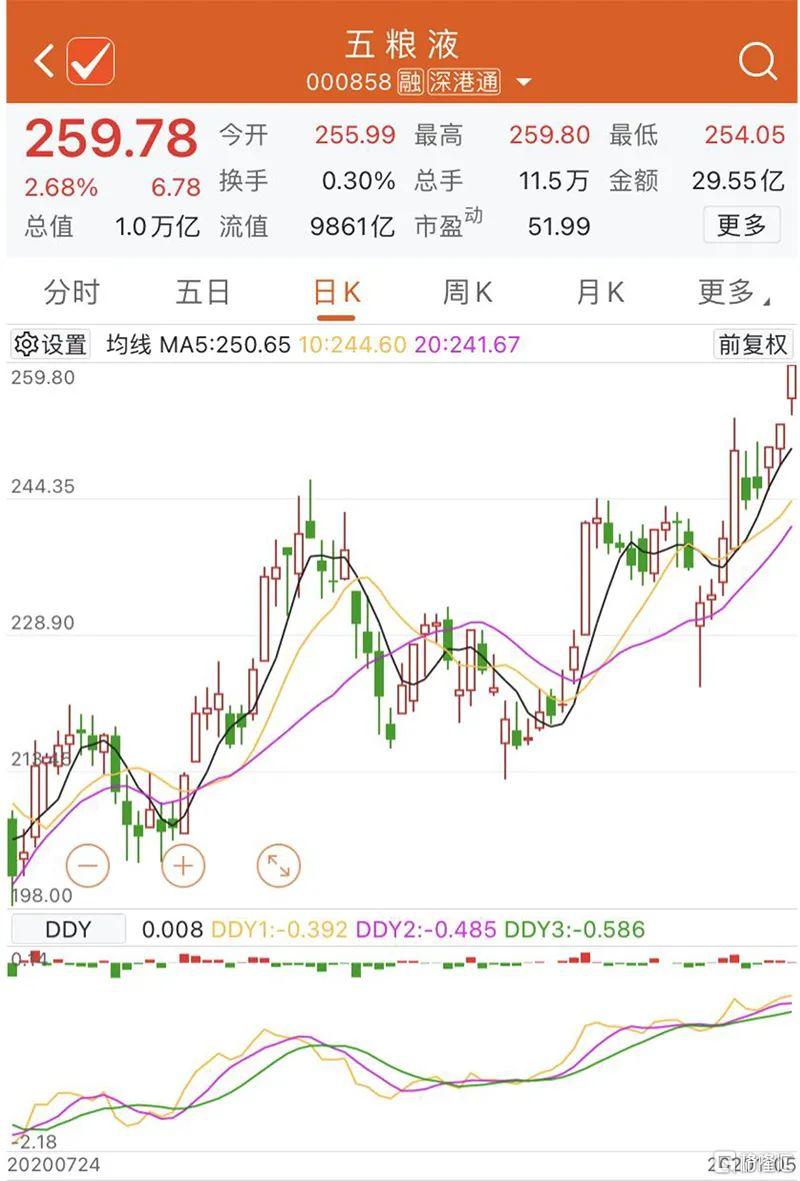
白酒、汽車板塊大漲,其中五糧液漲超2%,成為繼茅台之後,白酒股中第二隻總市值突破萬億元的公司。
五糧液總市值突破萬億元關口
週四早盤,白酒股再度成為資金關注的焦點。五糧液大漲2.68%,市值突破一萬億元關口。老白乾酒、酒鬼酒上封漲停,伊力特、青青稞酒、金種子酒等個股全線走高。
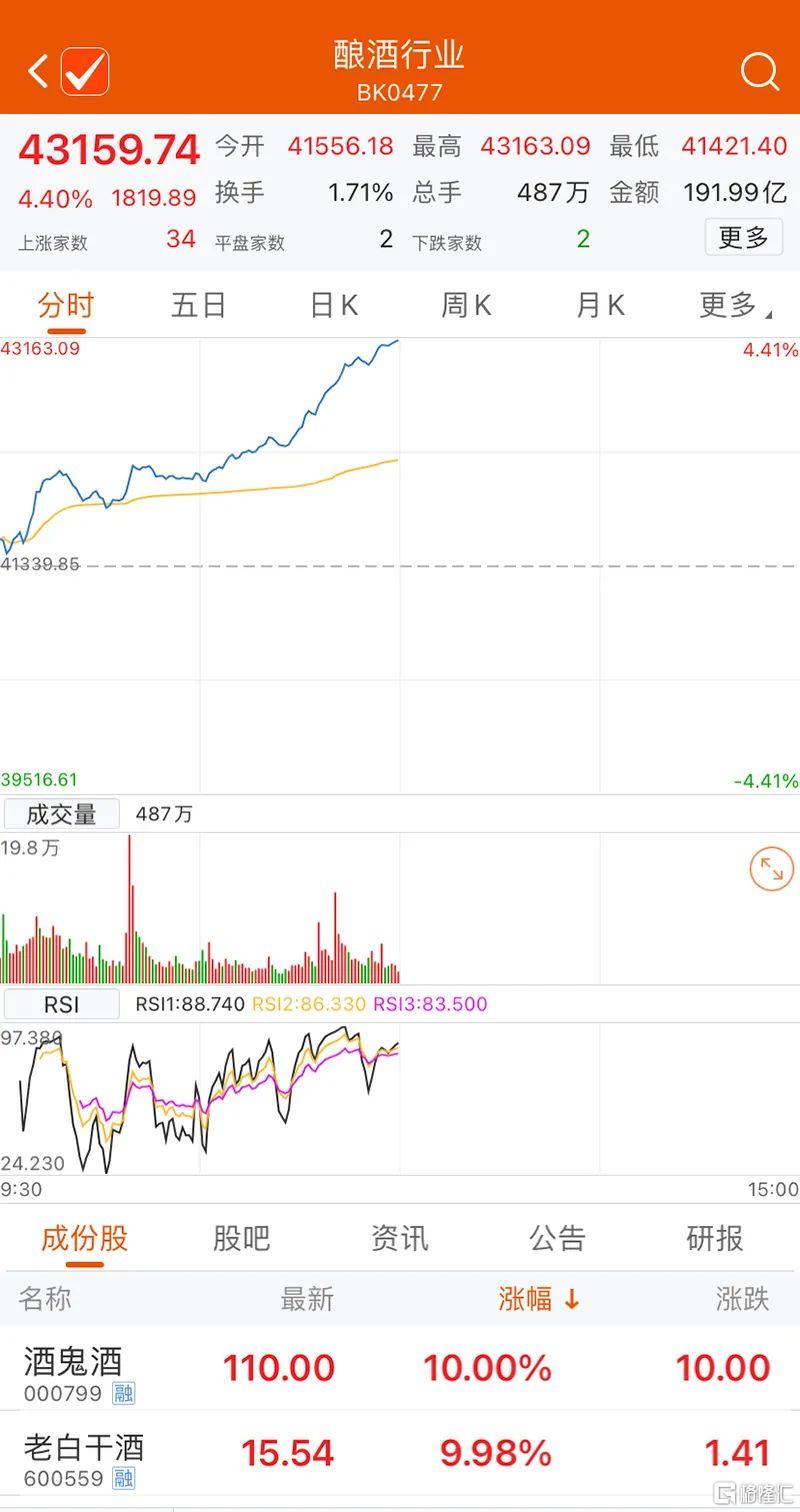
其中,五糧液成為白酒板塊第二隻突破萬億元關口的個股,截至午間收盤,五糧液今年以來的累計漲幅已經達到了97.94%,幾近翻倍。
Choice數據顯示,截至午間收盤,五糧液是A股市場第8只總市值在萬億元以上的個股。
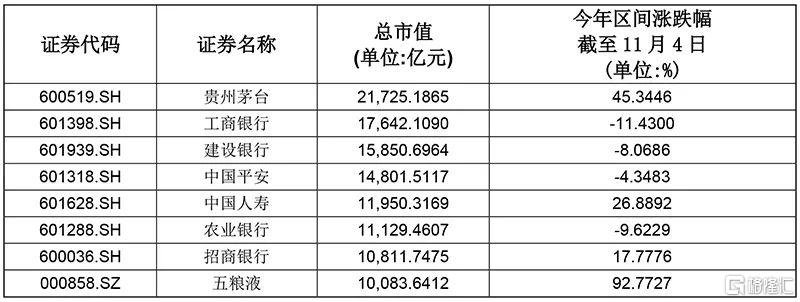
從上述表格來看,A股萬億元市值股票高度集中在白酒以及金融兩大板塊中,除貴州茅台、五糧液外,其餘6只個股分別為四家銀行股和兩家保險股。
但從年內股價表現來看,上述八隻個股走勢卻十分迥異。五糧液從年初的五千億市值開始走出翻倍行情。貴州茅台年內的漲幅也超過了45%。
另一方面,銀行股股價年內多數下跌,工商銀行、農業銀行年內跌幅在10%左右。以特色業務著稱的招商銀行年內漲幅超17%,此外中國人壽年內漲幅也超過了20%。
白酒板塊為何一直漲?
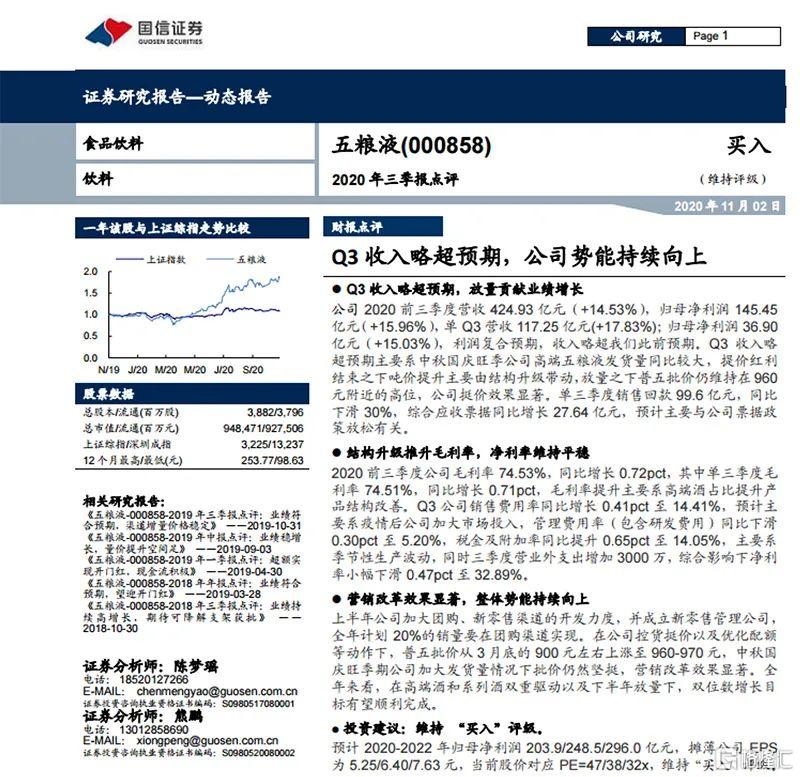
從基本面來看,三季報業績略超預期是五糧液近期股價持續走高的主要原因。日前,五糧液三季報出爐,公司前三季度營收、淨利均實現兩位數以上的增長,其中營收424.93億元,同比增長14.53%,同期歸屬於公司股東淨利潤145.45億元,同比增長15.96%。這一淨利潤增速已經超過貴州茅台。
中信建投表示,白酒板塊近期表現強勢,股價逆勢持續走高的狀況主要得益於一線白酒近期紛紛提價,中高端白酒格局逐漸清晰。同時,中高端和次高端白酒的市場佔有率和業績增速整體走強,從前三個季度來看,疫情對其的影響慢慢平復,整個白酒行業正趨於競爭格局良好的狀況。
不過也有市場分析人士認為,白酒行業目前的核心關注點已經從業績轉向估值。從歷史數據來看,目前各酒企估值都處於歷史高位。以申萬行業白酒市盈率為例,目前行業市盈率接近50倍,處於十年來最高值。
可選消費估值性價比明顯
除白酒板塊外,大消費板塊中還有家電以及新能源汽車兩大行業近期表現持續向好。
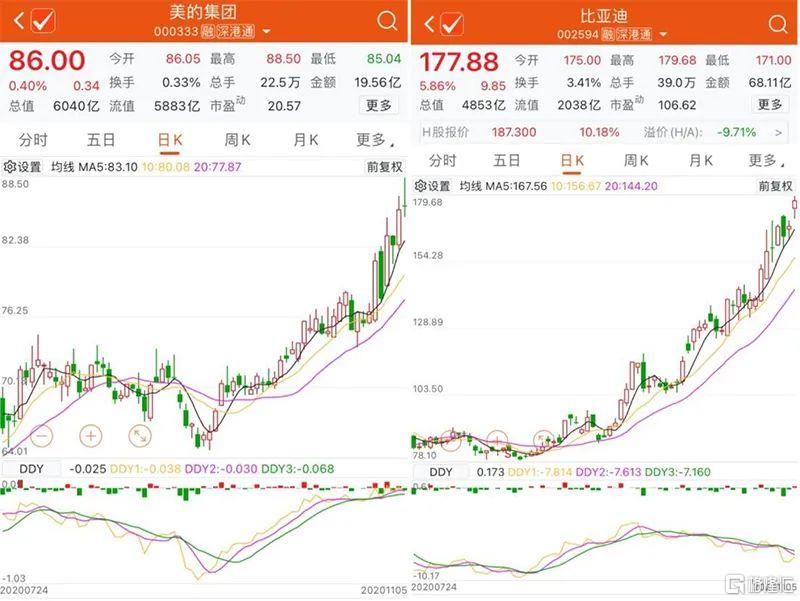
6000億家電龍頭美的集團今日盤中再度創下88.5元每股的歷史新高。新能源汽車龍頭比亞迪也於今日早盤觸及179.68元的歷史新高。
機構觀點分析認為,家電板塊和汽車板塊當前具有一個共同點,即均處於景氣度持續上行階段,投資者可篩選細分行業龍頭進行佈局。
國泰君安證券策略團隊表示,從三季報來看,消費板塊ROE為11.66%,不改上行通道,但可選消費性價比高於必選消費。可選消費毛利率的復甦值得關注,且估值性價比明顯。可選消費中,酒店、家電、家居等行業龍頭已經在疫情中加速強化行業優勢。行業亮點上,第三季度迅速回升的銷量令新能源汽車表現“一騎絕塵”,相關政策文件出台明確銷量“錨”,新能源汽車業績將持續改善。
Follow us
Find us on
Facebook,
Twitter ,
Instagram, and
YouTube or frequent updates on all things investing.Have a financial topic you would like to discuss? Head over to the
uSMART Community to share your thoughts and insights about the market! Click the picture below to download and explore uSMART app!

Disclaimers
uSmart Securities Limited (“uSmart”) is based on its internal research and public third party information in preparation of this article. Although uSmart uses its best endeavours to ensure the content of this article is accurate, uSmart does not guarantee the accuracy, timeliness or completeness of the information of this article and is not responsible for any views/opinions/comments in this article. Opinions, forecasts and estimations reflect uSmart’s assessment as of the date of this article and are subject to change. uSmart has no obligation to notify you or anyone of any such changes. You must make independent analysis and judgment on any matters involved in this article. uSmart and any directors, officers, employees or agents of uSmart will not be liable for any loss or damage suffered by any person in reliance on any representation or omission in the content of this article. The content of the article is for reference only and does not constitute any offer, solicitation, recommendation, opinion or guarantee of any securities, virtual assets, financial products or instruments. Regulatory authorities may restrict the trading of virtual asset-related ETFs to only investors who meet specified requirements. Any calculations or images in the article are for illustrative purposes only.
Investment involves risks and the value and income from securities may rise or fall. Past performance is not indicative of future performance. Please carefully consider your personal risk tolerance, and consult independent professional advice if necessary.


