一個比茅台還暴利的行業,遠期市場空間還有10倍
來源:脱水研報
市場行情最近持續震盪,適合儲備知識,為未來的大行情做好準備。今天給大家分享一個毛利率接近茅台的暴利行業——醫美。相關的龍頭公司愛美客上市10天以來已經暴漲了260%。
1、新時代最熱門的“消費品”?
(1)醫美的萬億市場空間
隨着國內人均可支配收入的快速增長,生活質量大幅提高,許多消費者越來越重視生活質量。在小紅書、微博等平台的教育下,美容成為了許多人新的追求,催生了醫美這個巨大的市場。
數據顯示,2012-2019年以來,醫美行業的複合增長率28.97%,達到1200億元。非手術類輕醫美項目越來越受消費者青睞,95後人羣成為醫美主力軍。
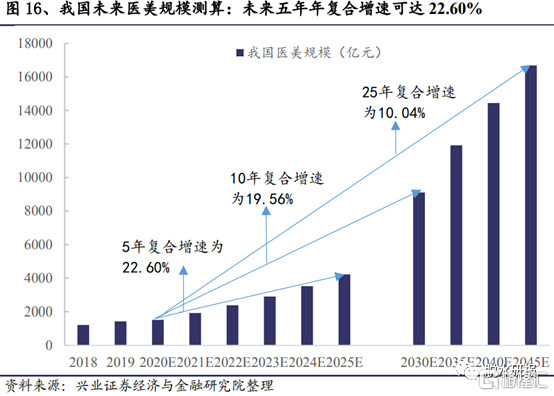
根據興業證券的估算,未來5年我國醫美市場的規模將保持22.6%的複合增速,到2025年醫美規模將達到4224億元;到2045年規模將達到16685億元,是2020年的10.94倍。
(2)毛利率高達90%,直逼茅台
整個醫美的產業鏈大致涵蓋:原料供應、醫美產品製造、醫美機構。其中醫美產品製造的毛利率竟然高達90%。作為對比,茅台的毛利率大約91.5%。另外兩個環節毛利率也不低,預料供應、醫美機構的毛利率分別為80%、60%。
2、未來增長的動力來源?
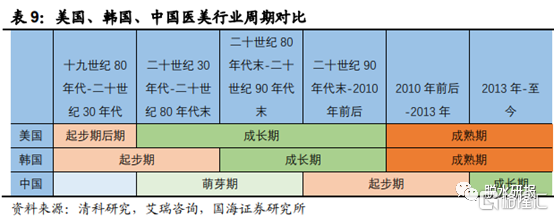
(1)國內市場處於初期
醫療美容與經濟發達程度高度相關,以美國和韓國這兩個成熟市場為例,美國2016年和韓國2018年的醫美市場規模分別達到1020億元、567億元人民幣。
而中國醫美市場還處於成長期,並且我國的人口規模是美國的4倍、韓國的27倍,龐大的人口基數給國內的醫美市場提供了堅實的消費基礎。
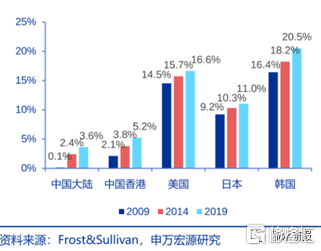
(2)滲透率僅3.6%,對標海外空間巨大
我國醫美市場發展較晚,目前滲透率僅3.6%,2019年美國、日本、韓國醫美市場滲透率分別是16.6%,11%,20.5%。對標韓國,還有超5倍的空間。
(3)監管嚴格,非法醫美迴流合規市場
2015年起,國家開始加強對醫美行業的監管力度,2019年,國家衞生健康委、公安部等7部門聯合開展嚴厲打擊非法醫療美容專項行動,全國公安機關共搗毀製售假藥黑窩點728個,總涉案金額近7億元,全國海關立案偵查、調查各類膠原蛋白、肉毒毒素等走私違法犯罪案件912起。
監管的嚴格,使得假貨市場萎縮,消費重新迴流正品市場。
3、為什麼中游的毛利率可以高達90%?
醫美產業從上游到下游,分別是原料供應商、醫美產品製造商、代理經銷商以及醫美機構。
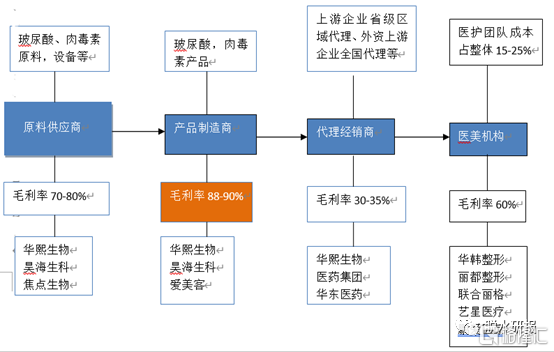
(1)上游原料供應商集中度較高,水假貨嚴重
細分來看,上游多個原料假貨嚴重,例如:
①玻尿酸市場規模持續擴大CAGR 達32.3%,其中超70%為水貨和假貨,目前十餘個品牌獲批,進口品牌市佔率較高,CR4 佔比70.3%;②肉毒素市場規模約65 億,水貨假貨佔比70%-80%。
隨着目前監管的完善和執行,獲得國家藥監局批准的公司,將贏得更高的附加值。
(2)中游產品製造商毛利率最高,原因竟在產品研發
醫美產品製造商的毛利率高達90%,處於整個產業鏈的高位。
其核心競爭力來源於產品技術和配方,而非原料。產品龍頭愛美客過去幾年研發支出穩步增長,從2015年的600萬增加到2019年的4900萬,產品包括玻尿酸、填充、童顏針等等,矩陣豐富,推新的頻率穩定且密集。
(3)下游醫美機構競爭激烈,整合提升空間較大
國內目前有1.3萬家醫美機構,2018 年,國內醫美機構正規市場規模878 億元,同比增速46.4%,黑市規模達1367 億元,同比增速24.3%。競爭格局高度分散,頭部機構營收規模佔比約10%。激烈的競爭使得獲客成本極高,每人次6000-7000 元,未來傳統醫美服務機構將與互聯網的聯繫越來越緊密,打開新流量入口,精細化運營。
Follow us
Find us on
Facebook,
Twitter ,
Instagram, and
YouTube or frequent updates on all things investing.Have a financial topic you would like to discuss? Head over to the
uSMART Community to share your thoughts and insights about the market! Click the picture below to download and explore uSMART app!

Disclaimers
uSmart Securities Limited (“uSmart”) is based on its internal research and public third party information in preparation of this article. Although uSmart uses its best endeavours to ensure the content of this article is accurate, uSmart does not guarantee the accuracy, timeliness or completeness of the information of this article and is not responsible for any views/opinions/comments in this article. Opinions, forecasts and estimations reflect uSmart’s assessment as of the date of this article and are subject to change. uSmart has no obligation to notify you or anyone of any such changes. You must make independent analysis and judgment on any matters involved in this article. uSmart and any directors, officers, employees or agents of uSmart will not be liable for any loss or damage suffered by any person in reliance on any representation or omission in the content of this article. The content of the article is for reference only and does not constitute any offer, solicitation, recommendation, opinion or guarantee of any securities, virtual assets, financial products or instruments. Regulatory authorities may restrict the trading of virtual asset-related ETFs to only investors who meet specified requirements. Any calculations or images in the article are for illustrative purposes only.
Investment involves risks and the value and income from securities may rise or fall. Past performance is not indicative of future performance. Please carefully consider your personal risk tolerance, and consult independent professional advice if necessary.


