You are browsing the Hong Kong website, Regulated by Hong Kong SFC (CE number: BJA907). Investment is risky and you must be cautious when entering the market.
韓廠退出超預期,面板漲價能否引發行業拐點
格隆匯 08-24 20:33

來源:Wind

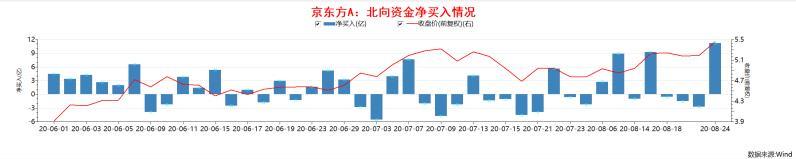
8月24日,京東方A再次出現在深股通十大成交活躍個股中,當日,北向資金淨買入11.2億元,其股價也大漲5.2%。

Wind注意到,近日京東方A並無基本面發生變化方面的公告,北向資金大手筆加倉可能與行業供給格局發生變化,從而導致的面板價格波動有關。

北向資金連續加倉

根據港交所披露的數據,自7月底以來,北向資金頻頻大手筆淨買入京東方A,7月23日淨買入5.6億元,8月13日淨買入8.9億元,8月17日9.2億元,算上8月24日的11.2億元,約一個月的時間內,北向資金已經累計淨買入34.9億元。期間,雖有淨賣出行為,但相對買入金額,明顯很小。

近期,北向資金大舉對某個股票增倉情況,並不多見。

LCD面板價格持續反彈

市場猜測,北向資金青睞京東方可能與面板價格波動有關。

7月份以來,大尺寸LCD面板價格持續反彈,平均漲幅達20%。集邦諮詢報告顯示,32英寸、43英寸、55英寸、65英寸面板價格7月份每片分別上漲了3美元、3美元、6美元和4美元。從面板價格上漲的空間可以看出,55英尺價格漲幅最高,其次是65英尺。

事實上,面板價格今年頻繁波動,並不稀奇。一季度上漲、二季度下降、三季度回暖。

本次面板價格波動的主要原因是:隨着疫情的逐漸控制,人們的購買力得到釋放,需求逐漸回暖並在第三季度得到進一步釋放。另外,隨着LG、三星、松下等部分品牌減產或停產液晶面板的生產,全球液晶面板產業鏈向國內傾斜。全球產業研究機構集邦諮詢提供的數據顯示,今年上半年,中國大陸液晶面板企業的全球市場佔有率為38%,位居世界第一。LG、三星等韓國企業的面板企業的全球市場佔有率降為33%,退居第二位。

行業供給格局生變

問題的關鍵是,面板的價格是一時反彈,還是具備趨勢性。有市場人士認為,韓廠退出LCD的節奏遠超預期。

從2019年三季度開始,日韓面板製造廠接連宣佈將要削減LCD產能,其中三星(SDC)計劃於今年第四季關閉全部的LCD產線(蘇州廠有出售意向),樂金顯示(LGD)將結束韓國本土電視面板生產,只保留廣州工廠的TV面板產能。

其中,LGD公司在韓國本土的大尺寸LCD產線為P7、P8產線,設計產能分別為230K/月、260K/月。預計P7線將於年底關停全部產線,P8線在年底將關停所有TV產線,餘留60K/月的IT面板產能。

三星公司在韓國本土的大尺寸LCD產線為L7-2、L8-1、L8-2產線,設計產能分別為160K/月、200K/月和150K/月。公司計劃在2020年底之前將所有產能全部退出,同時公司在蘇州的一條設計產能110K/月的8代線也將出售。

新增產能方面,2020年新增LCD產能主要來自大陸,在疫情影響之下,處於爬坡中的高世代產能擴張也放緩延後。其中,京東方武漢B17產線設計產能為120K/月,原計劃2020年一季度投產,目前受疫情影響,產能擴張放緩。惠科綿陽廠設計產能為150K,計劃2020年三季度投產,我們調整綿陽廠的產能年底能爬坡至60K/月。

不過,值得注意的是,面板的下游是電視機行業,由於新購機高峯早已過去,需求能否支撐面板價格長期上漲,需要打個問號。

Follow us
Find us on Facebook, Twitter , Instagram, and YouTube or frequent updates on all things investing.Have a financial topic you would like to discuss? Head over to the uSMART Community to share your thoughts and insights about the market! Click the picture below to download and explore uSMART app!
Disclaimers
uSmart Securities Limited (“uSmart”) is based on its internal research and public third party information in preparation of this article. Although uSmart uses its best endeavours to ensure the content of this article is accurate, uSmart does not guarantee the accuracy, timeliness or completeness of the information of this article and is not responsible for any views/opinions/comments in this article. Opinions, forecasts and estimations reflect uSmart’s assessment as of the date of this article and are subject to change. uSmart has no obligation to notify you or anyone of any such changes. You must make independent analysis and judgment on any matters involved in this article. uSmart and any directors, officers, employees or agents of uSmart will not be liable for any loss or damage suffered by any person in reliance on any representation or omission in the content of this article. The content of the article is for reference only and does not constitute any offer, solicitation, recommendation, opinion or guarantee of any securities, virtual assets, financial products or instruments. Regulatory authorities may restrict the trading of virtual asset-related ETFs to only investors who meet specified requirements. Any calculations or images in the article are for illustrative purposes only.
Investment involves risks and the value and income from securities may rise or fall. Past performance is not indicative of future performance. Please carefully consider your personal risk tolerance, and consult independent professional advice if necessary.
uSMART
Wealth Growth Made Easy
Open Account