咣咣漲停,又咣咣大跌!千億市值的股票,為何老是暴漲暴跌?
來源:上海證券報
咣咣漲停,又咣咣大跌,被視為價值標杆的千億市值龍頭,咋成了上躥下跳的題材股?
該賣,還是該買?
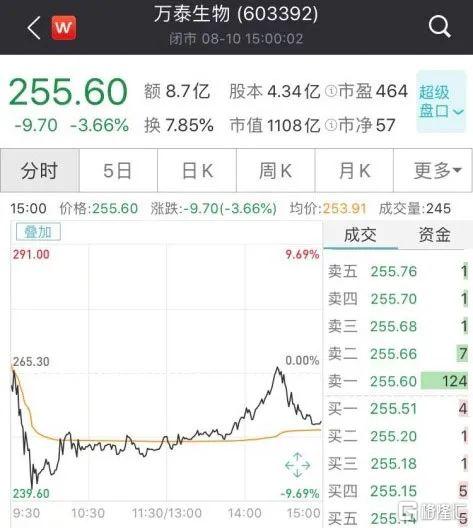
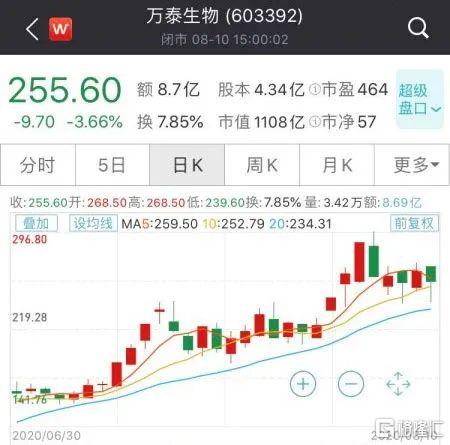
今日早盤,今年十倍股之一的萬泰生物,開盤僅十幾分鍾,跌幅便超過9%,此後跌幅收窄,最終收跌3.66%。
在A股市場,千億市值是個重要的門檻——如果一家公司的市值超過千億元,往往意味着其在產業領域已是響噹噹的龍頭公司,具備相當的產業影響力和市場號召力。
按道理説,公司市值超過千億,主營業務自然不會有太大變化,股價也應該表現穩健,可萬泰生物在進入千億市值行列後,股價表現反而是上躥下跳,波動幅度明顯增加。
7月30日、31日和8月3日,萬泰生物連續上漲,單日漲幅分別為10%、8.07%、9.86%。
到了8月4日,萬泰生物卻下跌9.81%,今天早盤又一度大跌。
萬泰生物並非個例。近期,有不少新晉千億市值的龍頭公司股價出現暴漲暴跌,波動巨大。
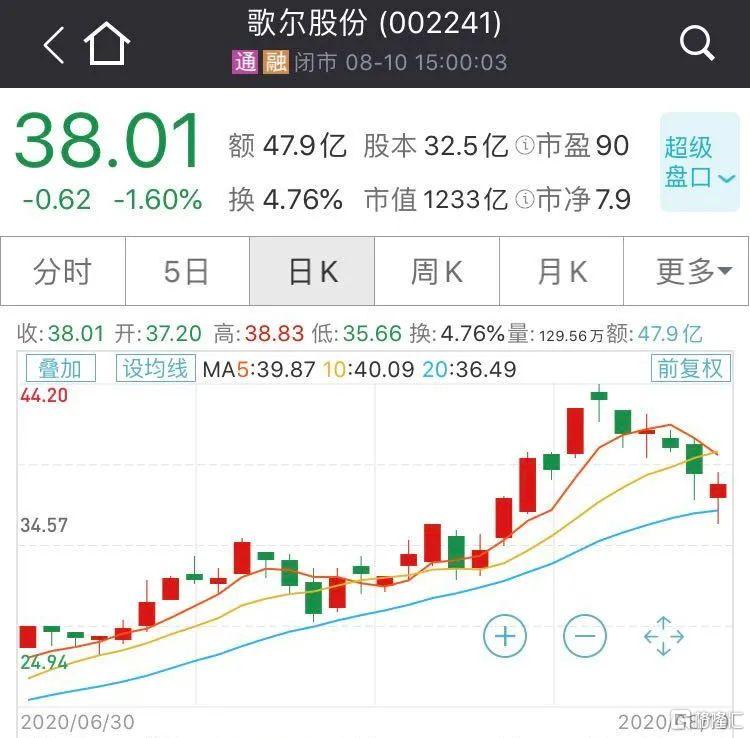
例如,歌爾股份在7月份表現搶眼,股價迭創新高,市值也超過千億元,股價隨之波動明顯加大,7月28日、29日分別上漲9.33%、6.22%,7月31日又大漲9.8%。但是,就在公司股價於8月3日創下歷史高點後,轉而連續下跌,今日早盤又下跌約7%。
又如,今年的大牛股華蘭生物、鵬鼎控股、北方華創等,均在邁上千億市值後,股價波動隨之增加。
這些千億市值的公司,為何上躥下跳?
先來看千億市值公司數量的變遷。
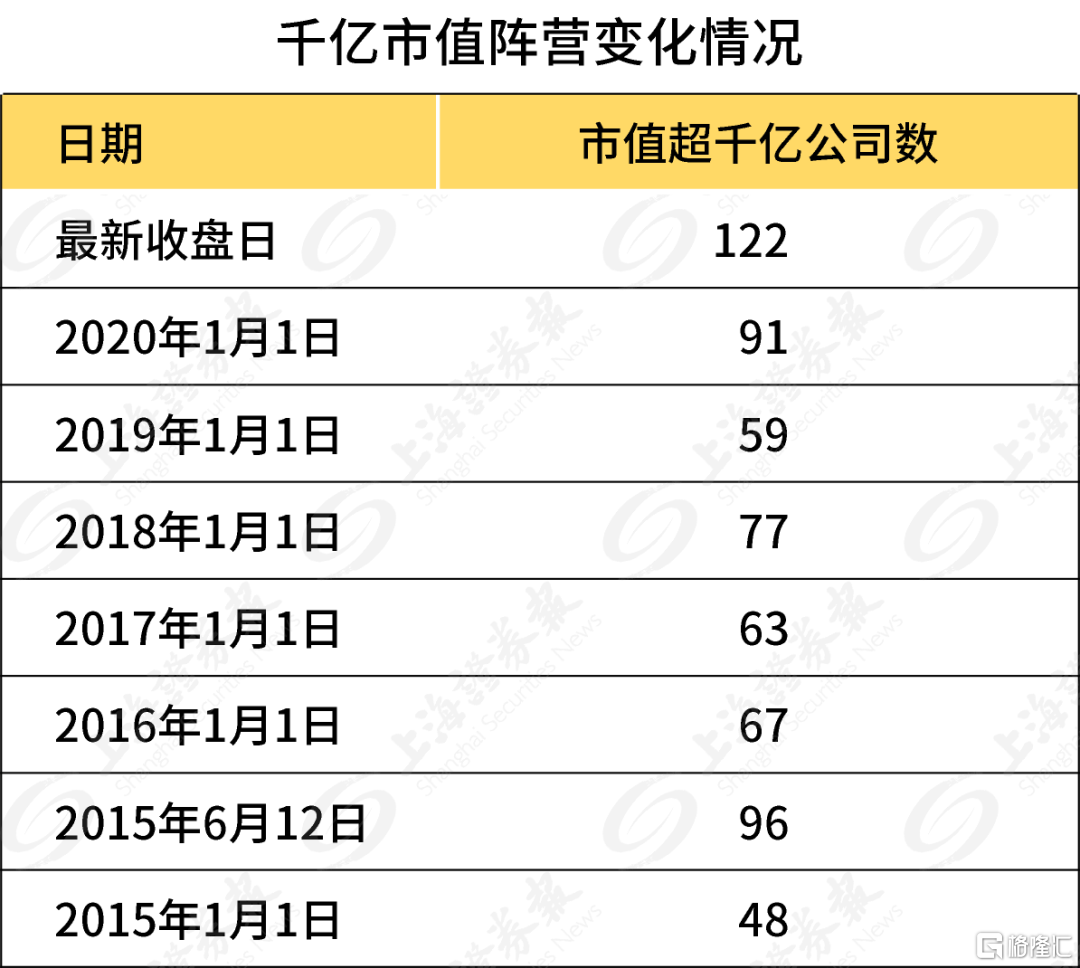
可以看出,千億市值陣營規模變化和市場情緒有很大的關係。當市場熱度較高,不少個股漲幅較大,千億市值陣營快速擴容;當市場降温,一些公司股價下跌,從而退出千億市值陣營。
以2015年為例,年初A股市場中超過千億市值的公司只有48家,到了年中,這一數據便翻了一倍,變為96家;而到了年底,千億市值公司又減少至67家。
那麼,今年有哪些公司新晉千億市值?大多來自集成電路、醫藥醫療、軍工等熱門板塊。
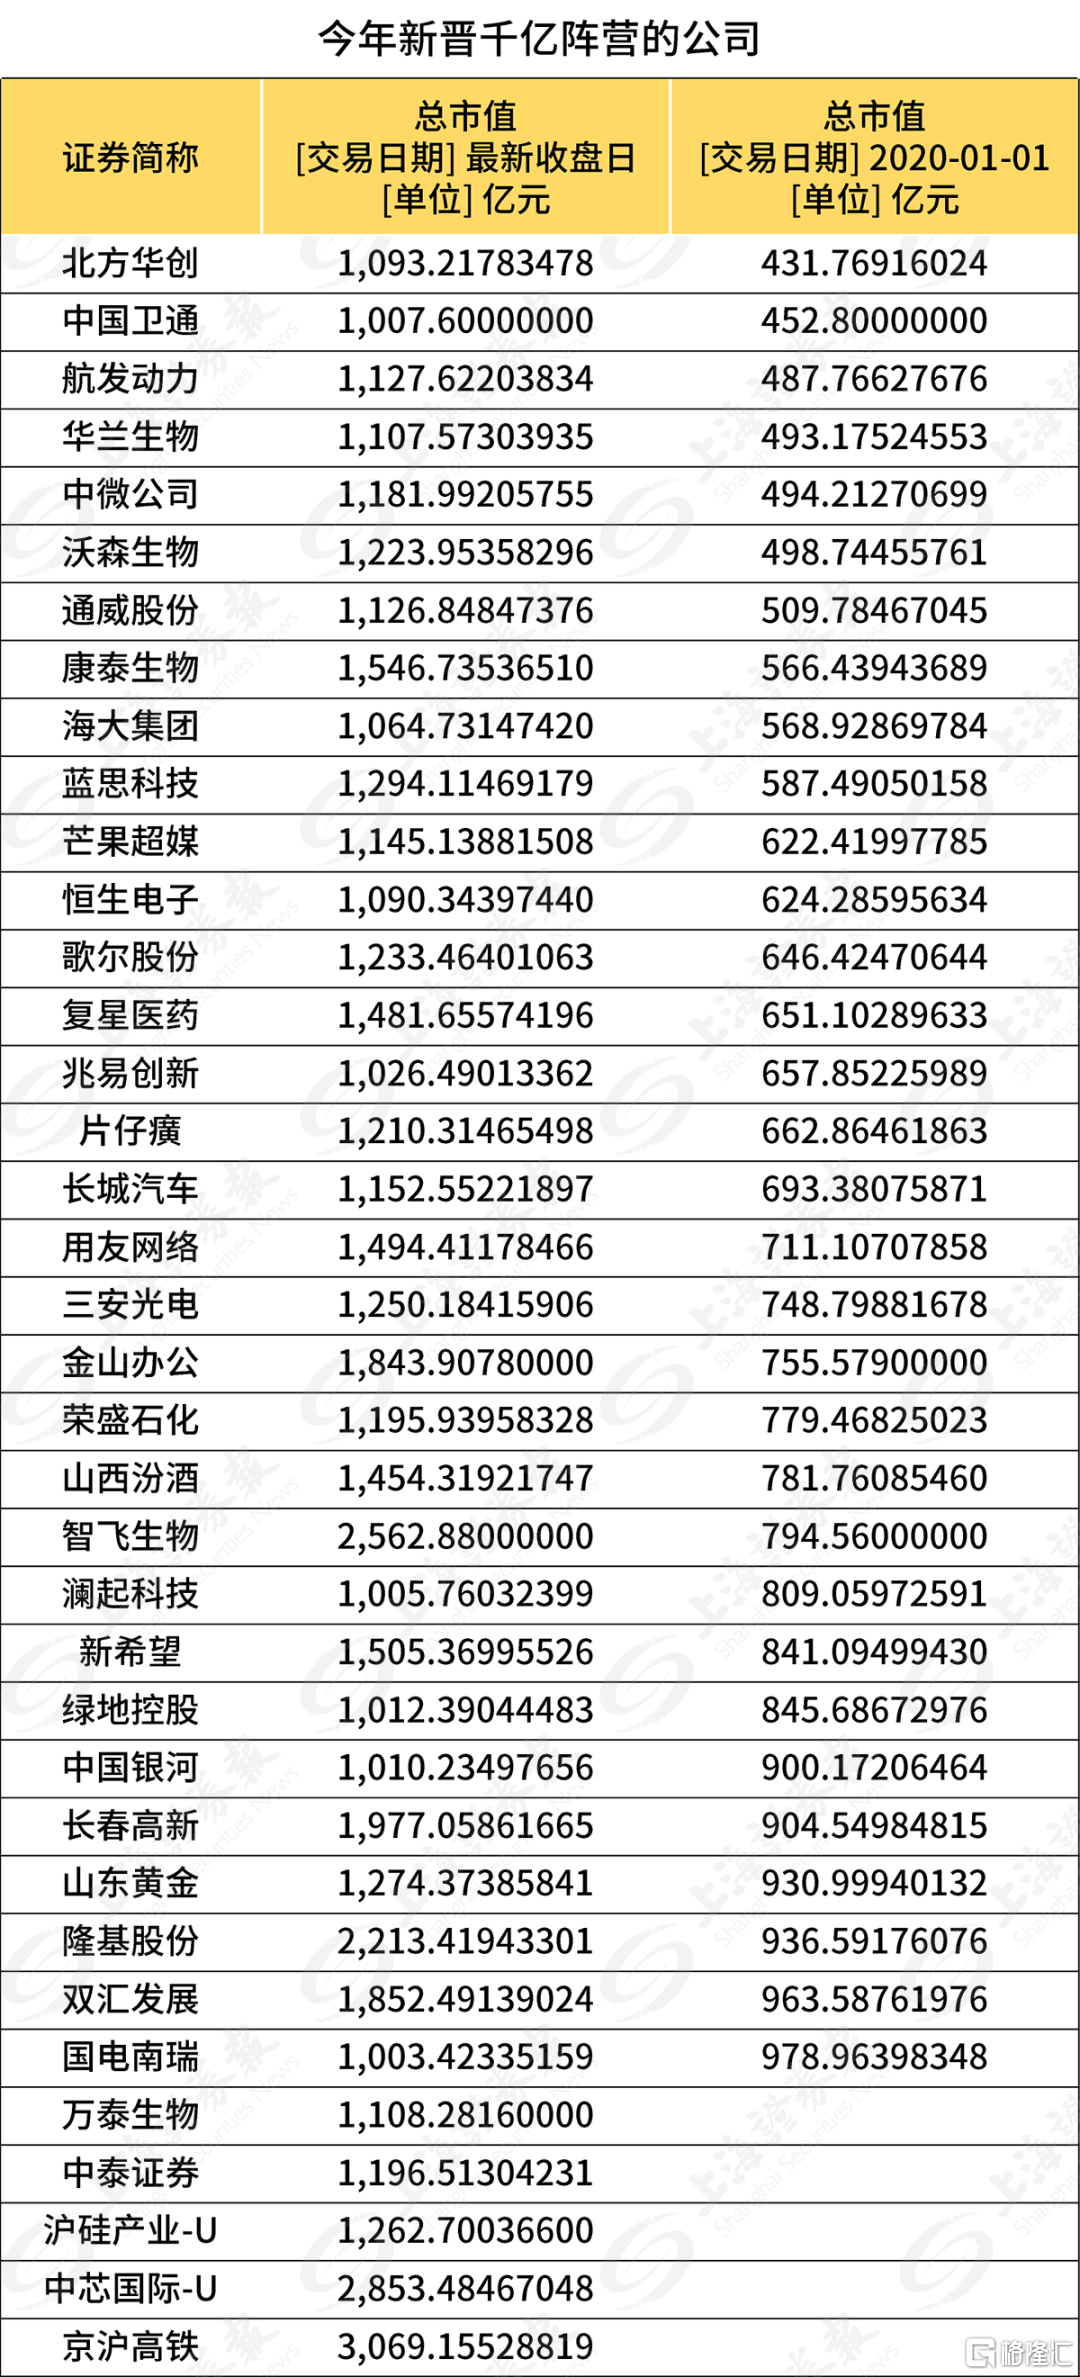
例如,華蘭生物今年年初市值約為490億元,最新股價為60.71元,年內漲幅超過126%,總市值已達1108億元。
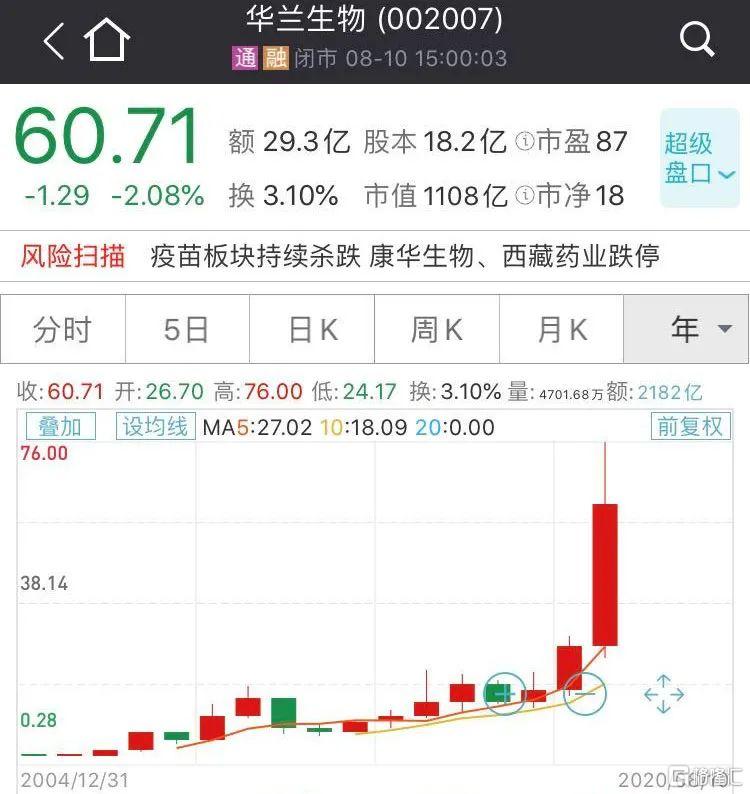
華蘭生物是A股血製品領域的龍頭公司,市場認為,新冠肺炎疫情出現以後,血製品需求旺盛,靜丙和白蛋白都在疫情防控中得到大量使用,在供給不平衡的情況下,血製品企業有望因此提高盈利能力。
航發動力則受益於市場對軍工概念股的追捧。根據最新收盤價,航發動力總市值為1128億元,而在今年年初時的總市值約為486億元,年內漲幅為132%。
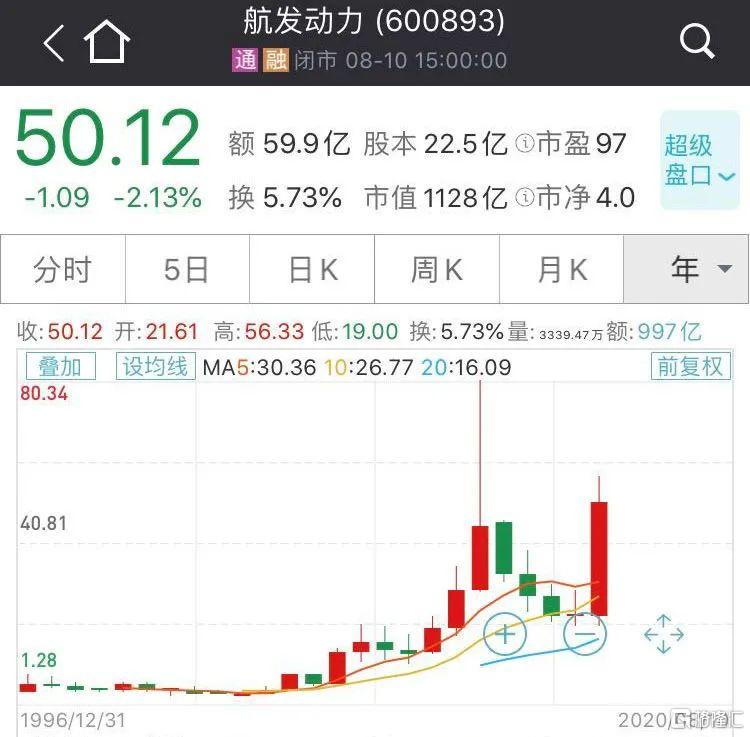
東興證券研究報告顯示,公司三代發動機的可靠性和穩定性已基本成熟,實現進口替代的概率日益增大。預計在3年內,公司在研的最新殲擊機發動機與運輸發動機將有重大突破。5-10年內,公司在研的用於C919的CJ-1000A渦扇發動機有望填補民用航空發動機空白。
Follow us
Find us on
Facebook,
Twitter ,
Instagram, and
YouTube or frequent updates on all things investing.Have a financial topic you would like to discuss? Head over to the
uSMART Community to share your thoughts and insights about the market! Click the picture below to download and explore uSMART app!

Disclaimers
uSmart Securities Limited (“uSmart”) is based on its internal research and public third party information in preparation of this article. Although uSmart uses its best endeavours to ensure the content of this article is accurate, uSmart does not guarantee the accuracy, timeliness or completeness of the information of this article and is not responsible for any views/opinions/comments in this article. Opinions, forecasts and estimations reflect uSmart’s assessment as of the date of this article and are subject to change. uSmart has no obligation to notify you or anyone of any such changes. You must make independent analysis and judgment on any matters involved in this article. uSmart and any directors, officers, employees or agents of uSmart will not be liable for any loss or damage suffered by any person in reliance on any representation or omission in the content of this article. The content of the article is for reference only and does not constitute any offer, solicitation, recommendation, opinion or guarantee of any securities, virtual assets, financial products or instruments. Regulatory authorities may restrict the trading of virtual asset-related ETFs to only investors who meet specified requirements. Any calculations or images in the article are for illustrative purposes only.
Investment involves risks and the value and income from securities may rise or fall. Past performance is not indicative of future performance. Please carefully consider your personal risk tolerance, and consult independent professional advice if necessary.


