為什麼東方雨虹如此受機構青睞?
作者 | cyy
數據支持 | 勾股大數據

近期,2020年二季度公募基金持倉情況披露,對比一季度,公募基金在建材板塊方面整體有所減持,水泥行業由於受二季度雨水天氣影響遭減持力度最大。
從整個建材板塊看來,最受公募基金青睞的個股是防水材料龍頭東方雨虹,在二季度建材整體遭減持的背景下,公募對於東方雨虹可謂"一往情深",持倉上較一季度幾無變化。
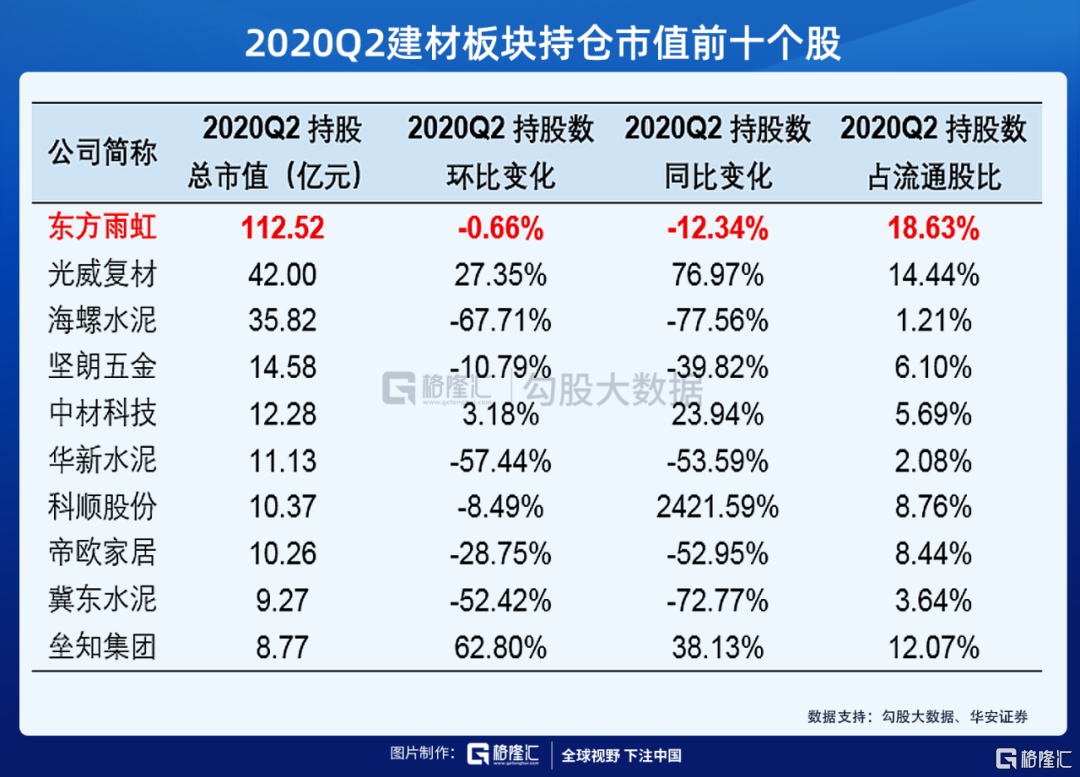
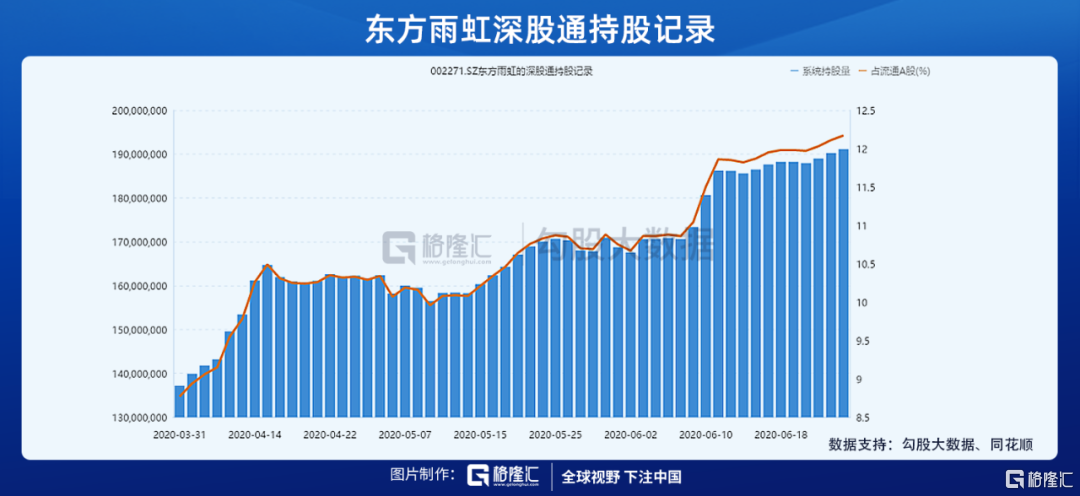
同樣,北上資金也對東方雨虹鍾愛有加。二季度,北上對東方雨虹大幅加倉,深股通持股佔比由8.77%提升了3.4個百分點至二季度的12.17%。
近年來,東方雨虹一直是機構青睞的個股,這背後的邏輯是什麼呢?
01
市場邏輯:政策助力,行業集中度大幅提升
我國建築防水材料行業市場空間巨大,但行業壁壘不高。其中,非標產品佔到行業總產量的80%左右,龍頭市佔率較低,CR10不到23%。2019年,我國規模以上防水材料企業數量僅佔全市場的20%左右,小工廠與小作坊佔據巨大市場份額,行業集中度低,整體產能利用率也偏低。
近年來,防水材料行業監管和環保逐漸趨嚴,國家不斷出台政策淘汰非標產品和落後產能提升行業門檻。2019年,國家出台《住宅項目規劃》徵求意見稿,將屋面防水、地下工程等工程年限提高,使防水材料的耐久性引起市場重視。
同年,國家出台《工程結構通用規範》徵求意見稿,要求不同應用領域的建築工程防水層設計提高。隨着政策加碼,行業顯示出規範化的趨勢,防水材料龍頭企業逐步吃下非標產品的市場份額,行業集中度不斷提升中。
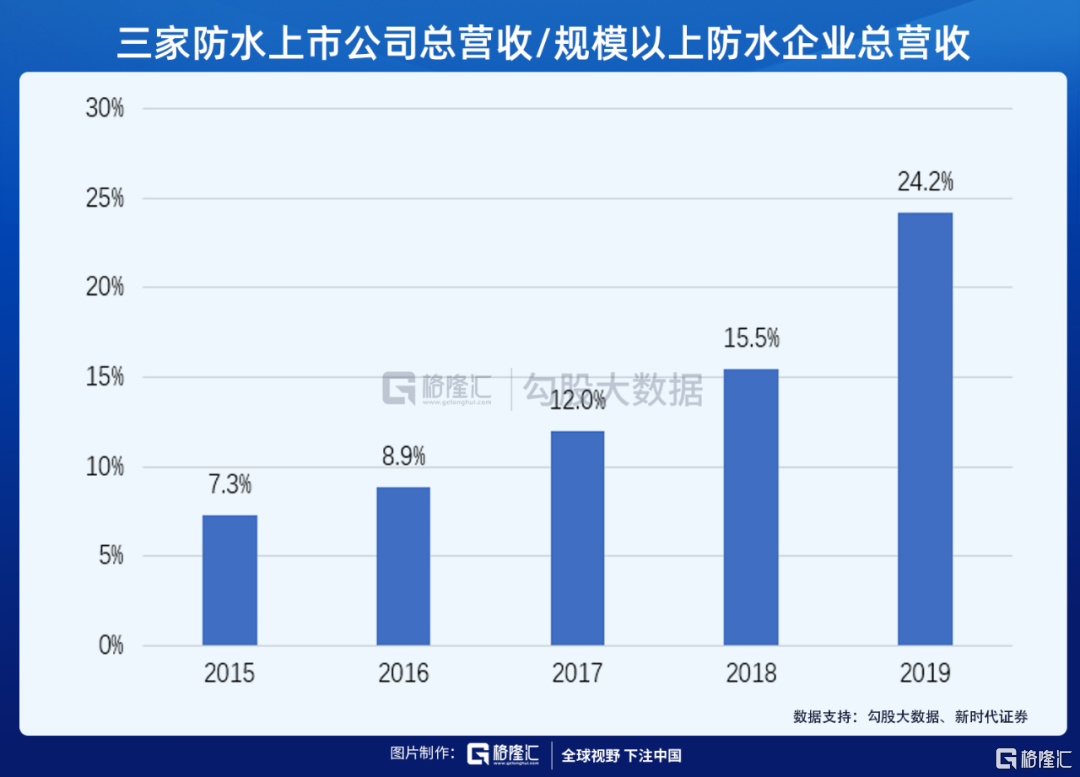
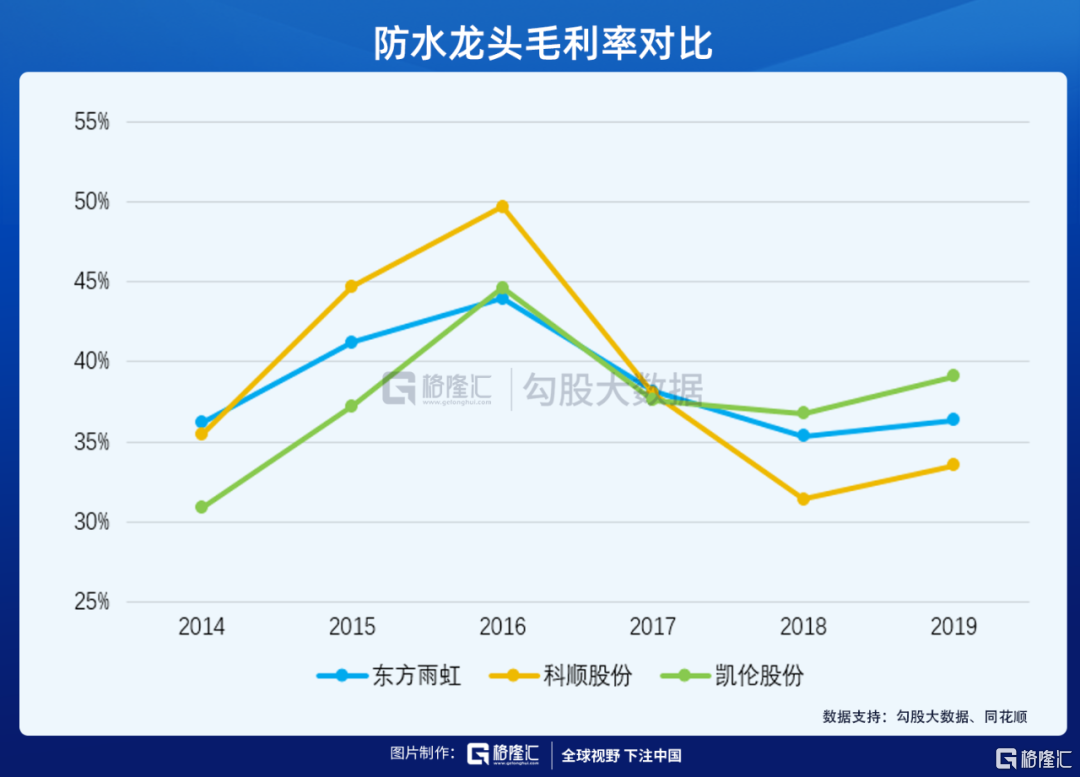
行業內,東方雨虹、科順股份、凱倫股份為防水材料行業TOP3。近5年來,在規模以上防水企業中,"三巨頭"營收佔比由7.3%大幅增長至24.2%,龍頭效應卻來越強。
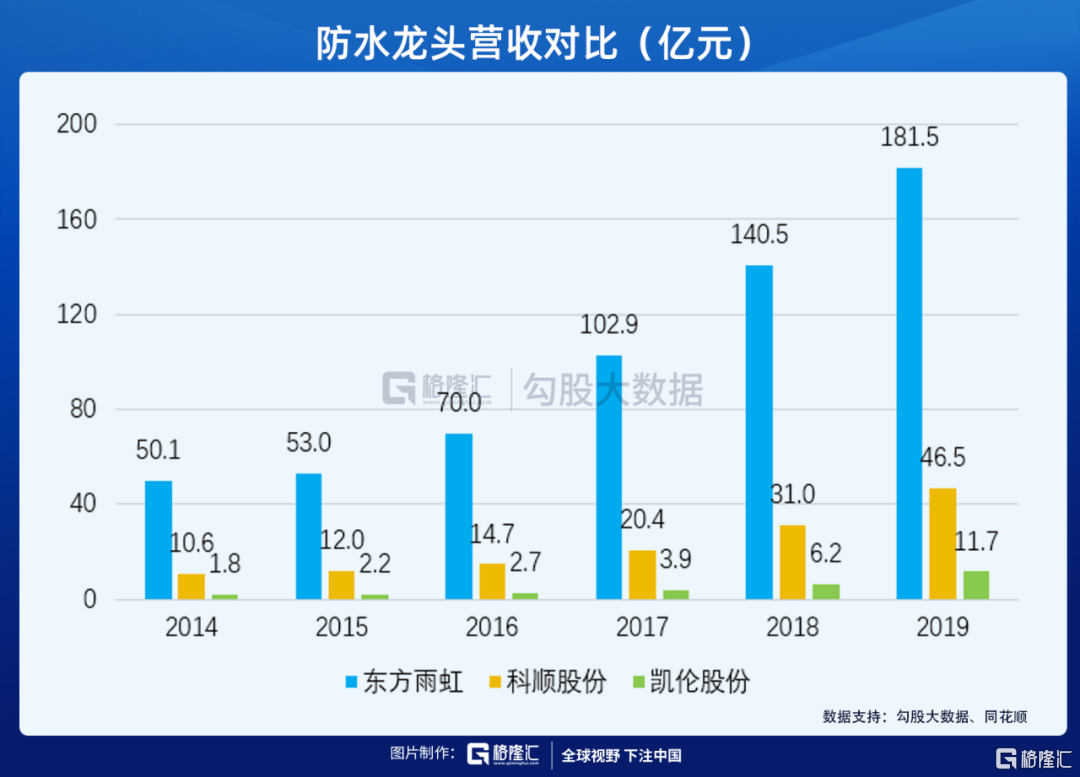
對比三家公司營收端表現,東方雨虹處於遙遙領先的位置。公司在全國擁有28家生產物流研究基地,在業務上覆蓋範圍更廣。由於有運輸條件與運輸成本方面的考慮,防水材料也如同水泥一樣擁有"運輸半徑"。一般來説,防水材料的經濟銷售半徑為500公里,東方雨虹的全國佈局使其對比科順與凱倫擁有了更高的市佔率,而更高的產能也為公司營收保駕護航。
另一方面,由於防水行業應收賬款佔比較重,現金流一直是市場擔憂的風險點,但隨着公司全國佈局基本完成,未來的產能擴張由新建基地向加裝設備轉變,資本開支將大幅降低,因此現金流風險大幅下降,帶來估值端的提升。
防水材料的上游原材料主要為瀝青等石油化工產品,在防水材料的成本佔比中超過八成。其中瀝青價格與國際原油價格相關度很高,較低行業集中度的防水材料企業對上游原材料供應議價能力有限。東方雨虹由於規模效應,集採優勢較大,受原材料價格波動影響小於其他企業,因而毛利率較為穩定,也帶來了更為穩定的業績表現。
我國房屋建築防水成本投入普遍較低,滲漏比例較高,因此有較高的修繕需求。據新時代證券測算,我國每年的防水存量市場空間就有千億,目前存量市場對於專業防水企業來説還是一片藍海,作為行業第一的東方雨虹現有市佔率約10%,仍有巨大提升空間,因此成為機構重倉的理由。
02
下半年預期:業績較上半年大幅提升
現階段,行業集中度的邏輯已經基本被市場消化,在前一階段的估值提升中已經反應。下半年,東方雨虹的股價有望受業績表現所驅動。
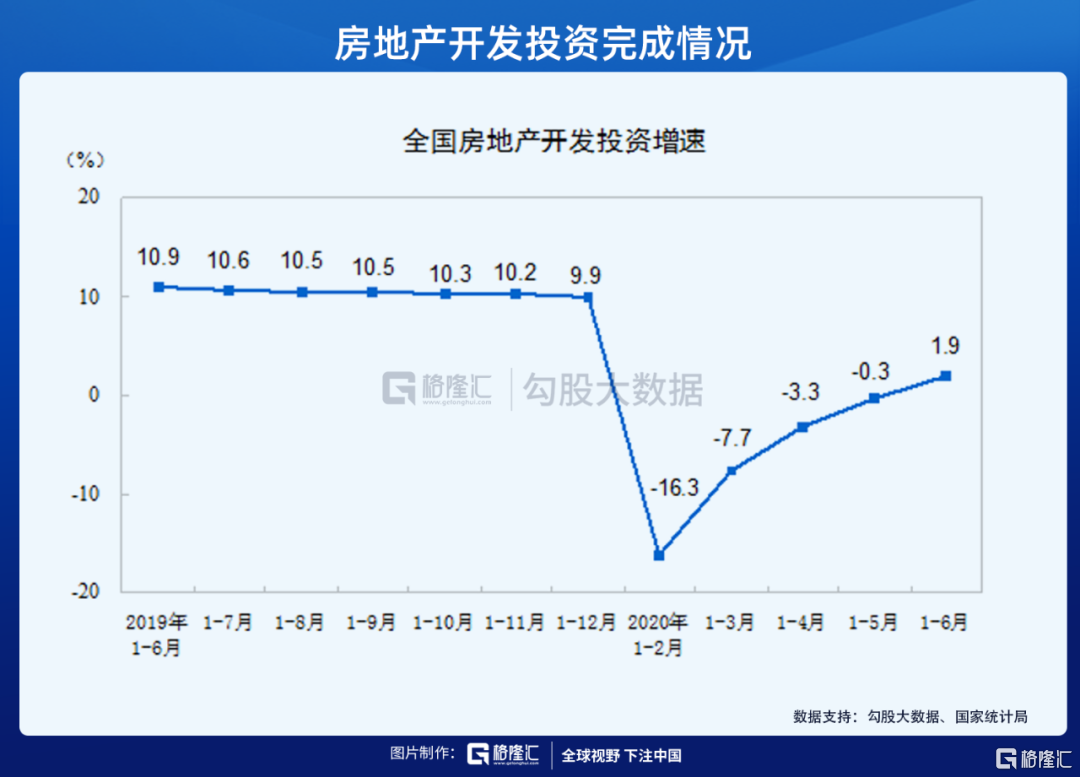
今年上半年由於疫情影響,防水材料下游的房地產施工受到較大影響,建材板塊需求受到抑制。隨着6月房地產開發投資增速由負轉正及雨季離去,房地產行業逐漸回暖,積累的施工需求疊加洪災重建需求,下半年防水材料出貨量有望迎來大幅提升。
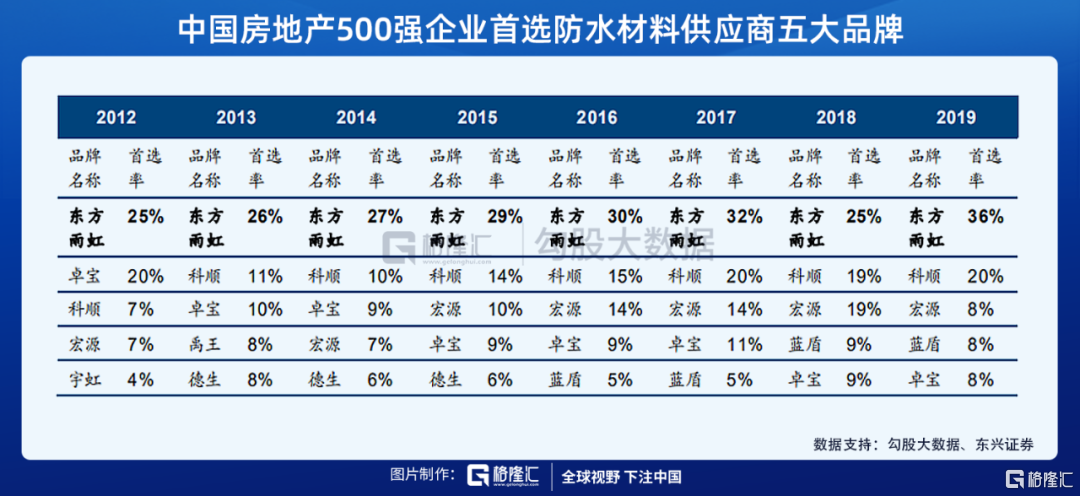
此外,東方雨虹也頗受地產商的青睞,自2012年起,東方雨虹均為中國房地產500強企業首選防水材料供應商,隨着龍頭地產商的助力,東方雨虹的業績確定性將會強於其他同行。
03
總結
現階段,東方雨虹的股價已經反應市場對防水行業集中度提升的預期,而對比也同樣充分反應的科順股份(PE TTM:46.5)與凱倫股份(PE TTM:50.5),東方雨虹的市盈率相對較低(PE TTM:41.2)。下半年隨着施工回暖,受房地產龍頭青睞的東方雨虹業績確定性將會更強,股價有望受業績驅動而提升。
Follow us
Find us on
Facebook,
Twitter ,
Instagram, and
YouTube or frequent updates on all things investing.Have a financial topic you would like to discuss? Head over to the
uSMART Community to share your thoughts and insights about the market! Click the picture below to download and explore uSMART app!

Disclaimers
uSmart Securities Limited (“uSmart”) is based on its internal research and public third party information in preparation of this article. Although uSmart uses its best endeavours to ensure the content of this article is accurate, uSmart does not guarantee the accuracy, timeliness or completeness of the information of this article and is not responsible for any views/opinions/comments in this article. Opinions, forecasts and estimations reflect uSmart’s assessment as of the date of this article and are subject to change. uSmart has no obligation to notify you or anyone of any such changes. You must make independent analysis and judgment on any matters involved in this article. uSmart and any directors, officers, employees or agents of uSmart will not be liable for any loss or damage suffered by any person in reliance on any representation or omission in the content of this article. The content of the article is for reference only and does not constitute any offer, solicitation, recommendation, opinion or guarantee of any securities, virtual assets, financial products or instruments. Regulatory authorities may restrict the trading of virtual asset-related ETFs to only investors who meet specified requirements. Any calculations or images in the article are for illustrative purposes only.
Investment involves risks and the value and income from securities may rise or fall. Past performance is not indicative of future performance. Please carefully consider your personal risk tolerance, and consult independent professional advice if necessary.


