伊利股份:板塊大漲龍頭價值幾何?
作者 | 格隆匯小編
數據支持 | 診股寶

今日收盤行業板塊多數上漲,食品飲料板塊漲幅最大,而其中乳業相關企業表現尤為亮眼。板塊內新乳業、莊園牧場、天潤乳業漲停,妙可藍多漲9.64%、光明乳業上漲8.03%。港股蒙牛乳業也有5.43%漲幅。
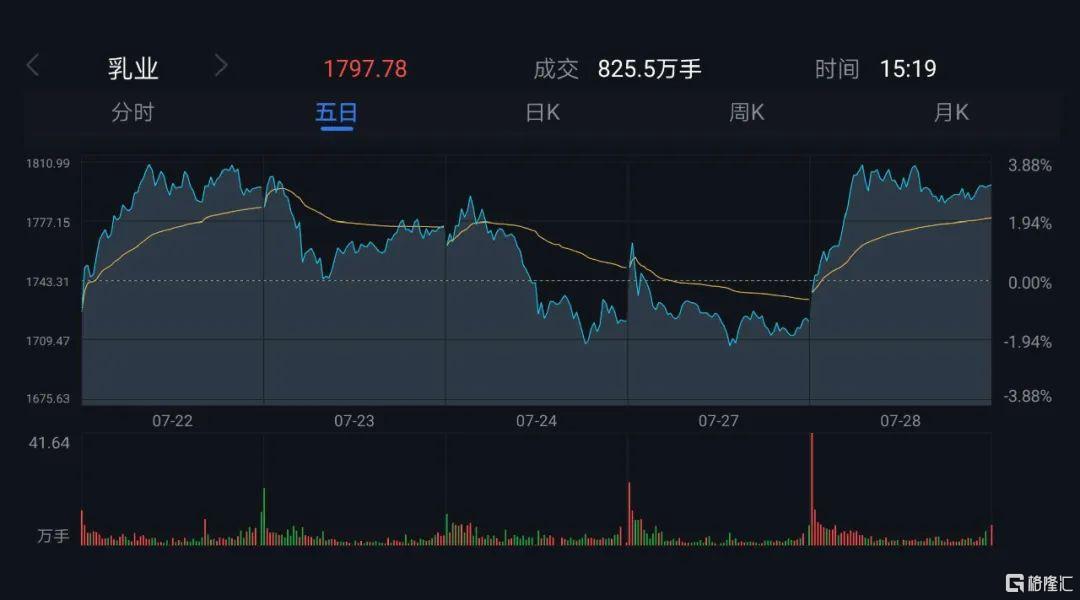
圖:乳業板塊今日走勢
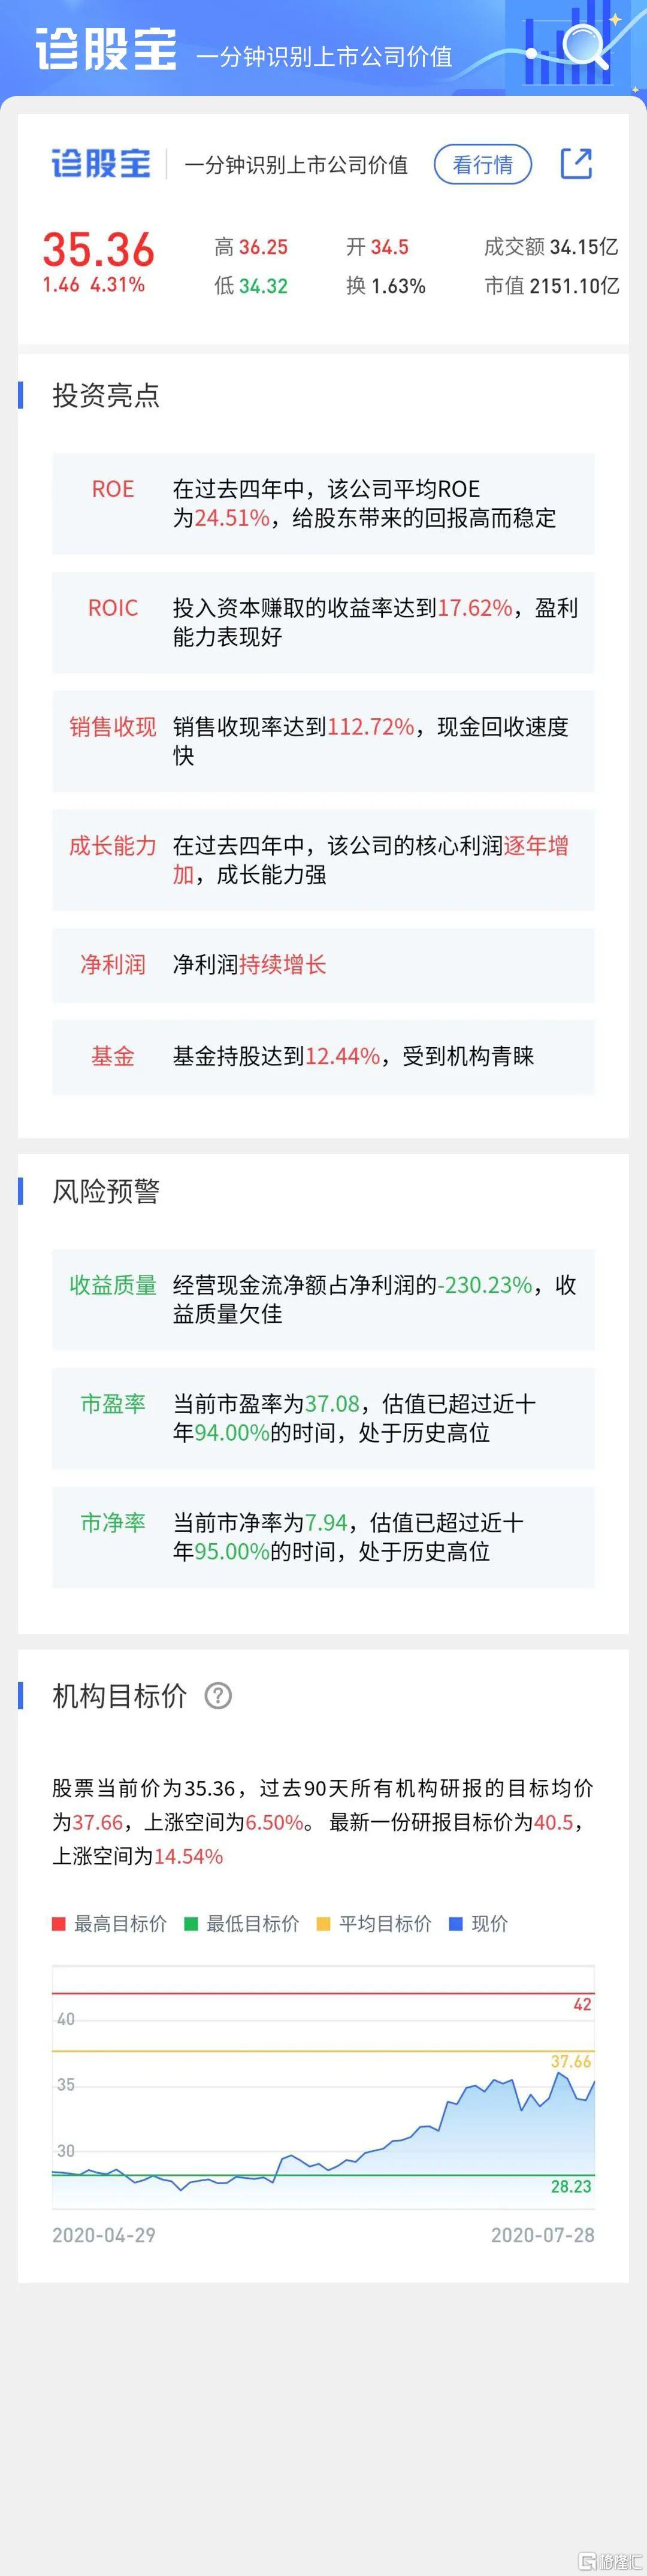
相比上面幾家企業,身為板塊龍頭的伊利控股表現就較為平淡。今日開盤伊利股份高開高走來到36.25,這個價位一度接近一週前的最高價36.63元,但後來股價卻一路回落,截至收盤,伊利股份報35.36元,漲幅在4.31%。
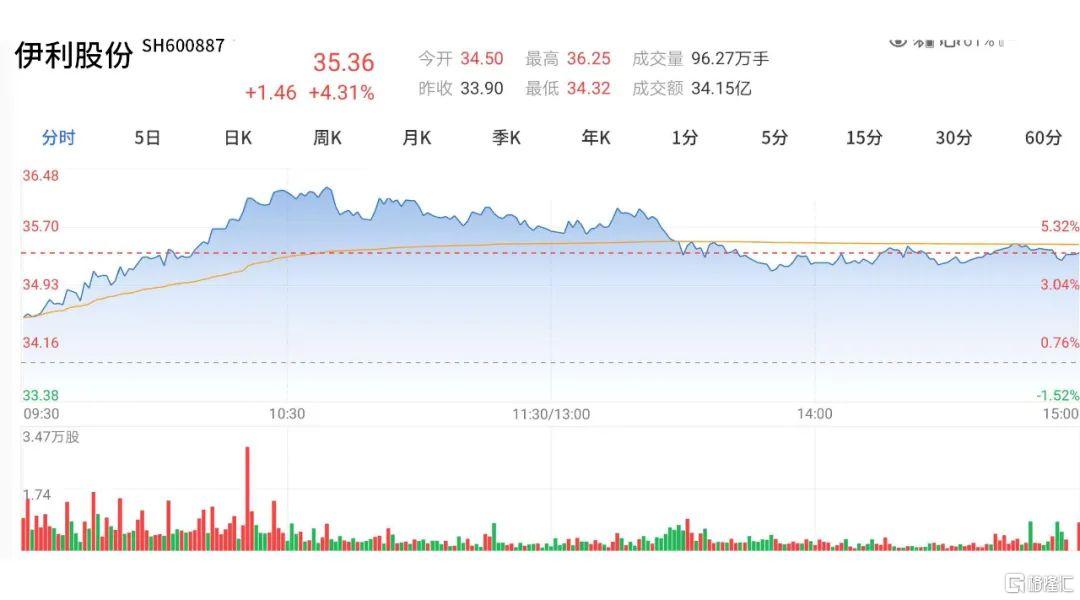
圖:伊利股份分時圖
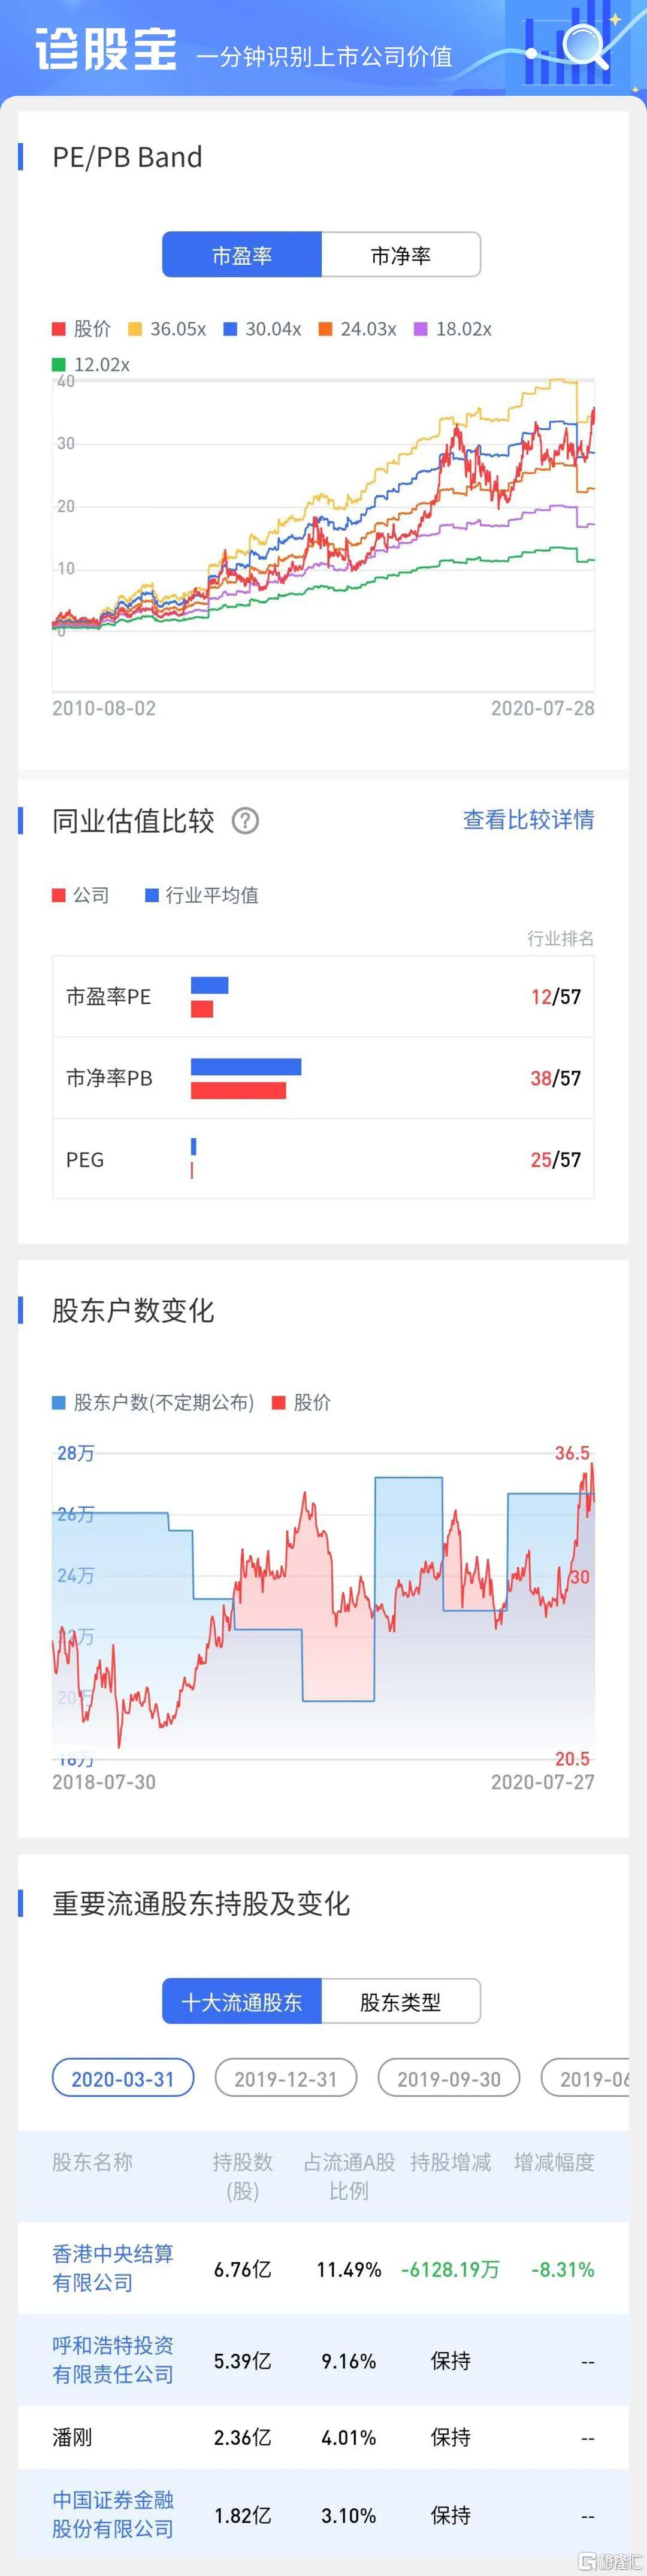
然而別看伊利股份並未領漲板塊,資金追捧伊利的熱情一點也不比那些漲停股差。根據診股寶數據,伊利股份已經連續兩月獲得北上資金淨流入,目前北向資金佔流通股比重已經來到13.18%,另外基金持股比例也來到12.44%,當下的伊利股份毫無疑問是北上資金和機構的熱捧股。
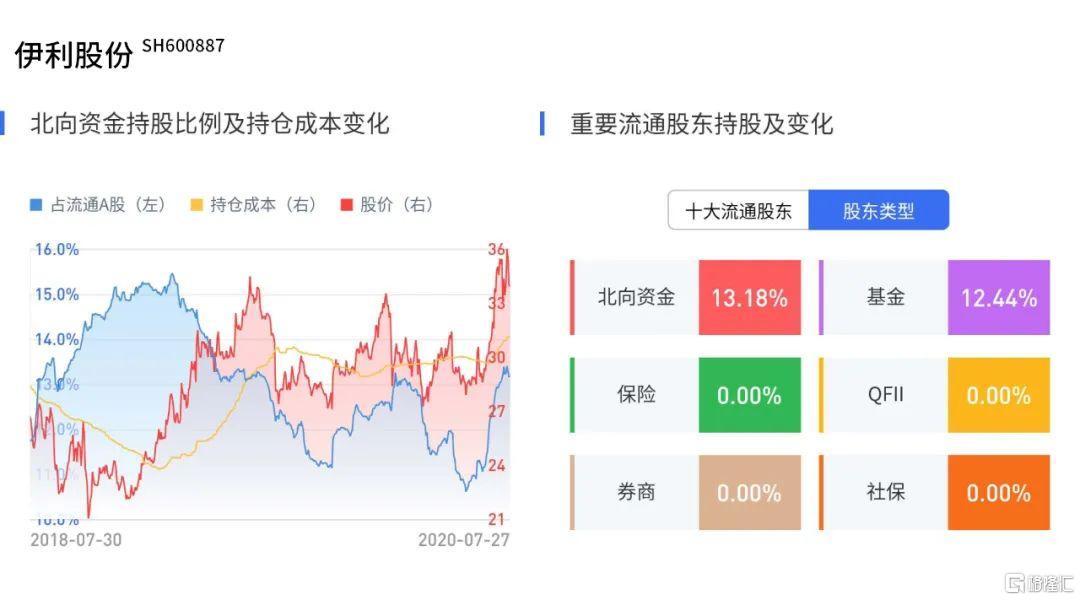
圖:診股寶--向資金流動變化和重要股東排行
此外,根據數據,目前伊利股份融資餘額也已經來到了近三個月的高點,表示市場看多的情緒比較強烈。融券餘額減少表示市場看空意願減弱。
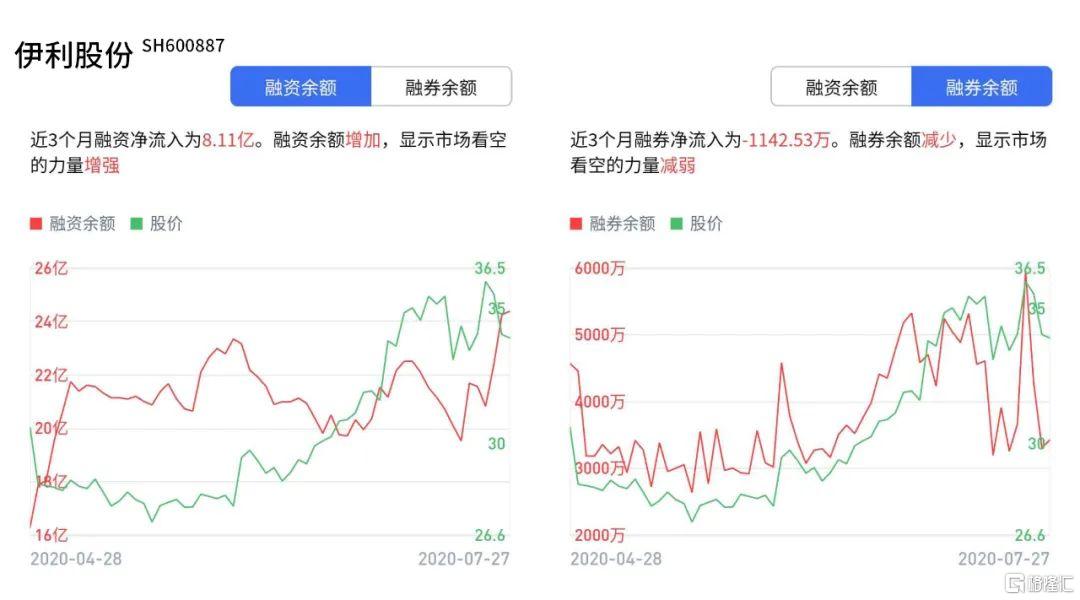
根據種種跡象,近期市場對於伊利股份的投資熱情是持續增加的。
近兩日,伊利股份的股價不是板塊內表現最搶眼的,但是卻絕對是受到最多人看好的!為什麼資金趨向該股集中?我們從基本面、行業狀況、估值三方面分別分析:
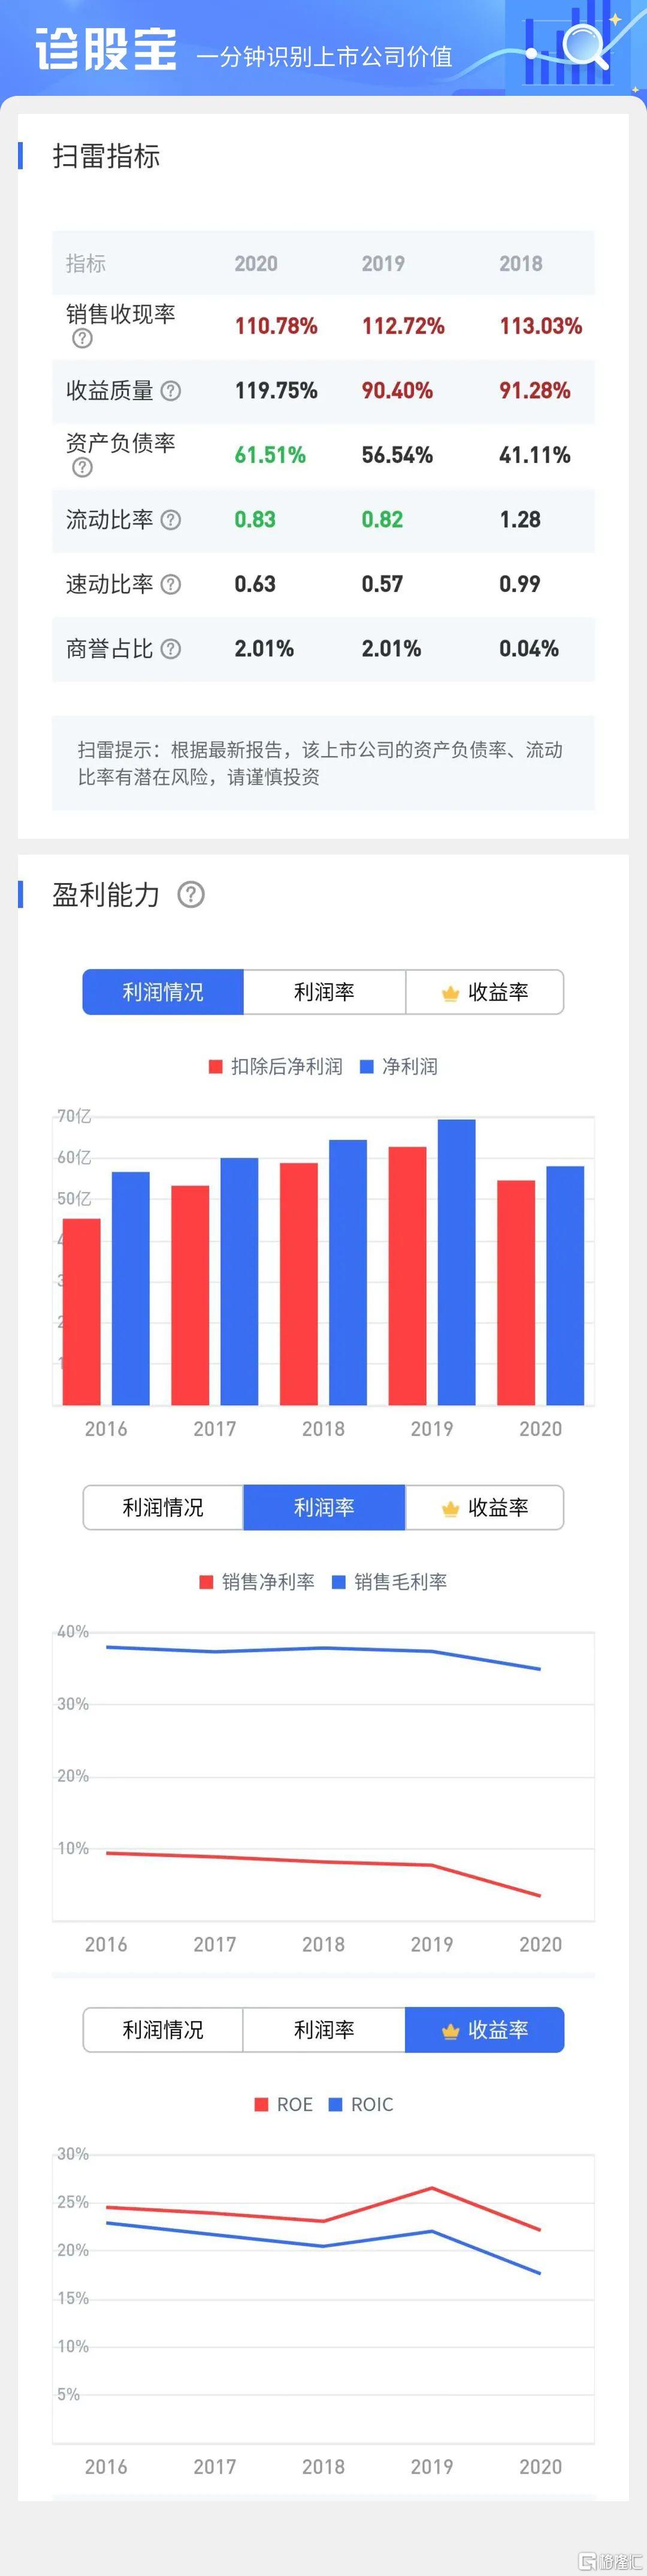
首先基本面。20年Q1收入同比下滑10.71%,20年歸母淨利潤則同比下滑49.78%,大幅低於市場預期,這主要源於疫情影響銷售狀況,並且上半年市場投放力度加大,攤薄了利潤的原因所致。
撇開疫情之下的一季度,在過去四年中,營收和淨利潤也能保持穩定上漲,平均ROE為24.51%,ROIC也高達17.62%,可見其良好的盈利能力,且能為股東帶來高而穩定的回報。
其次,疫情過後行業集中度也有望增強,調研數據顯示,雖然伊利Q1總體應收以及淨利潤下降,但是其產品的市場佔有率卻不減反升。2020年Q1,伊利常温奶市佔率39.3%,同比提升1.1%。此外,通過渠道調研,疫情後KA賣場中堆頭陳列基本以大品牌為主,中小品牌動銷仍未恢復至正常水平,且庫存去化緩慢。有利於伊利後續進一步搶佔市場份額。
疫情後期,伴隨渠道快速恢復以及消費者對乳製品高營養蛋白的需求明顯提升,乳製品行業也將迎來較快的恢復。
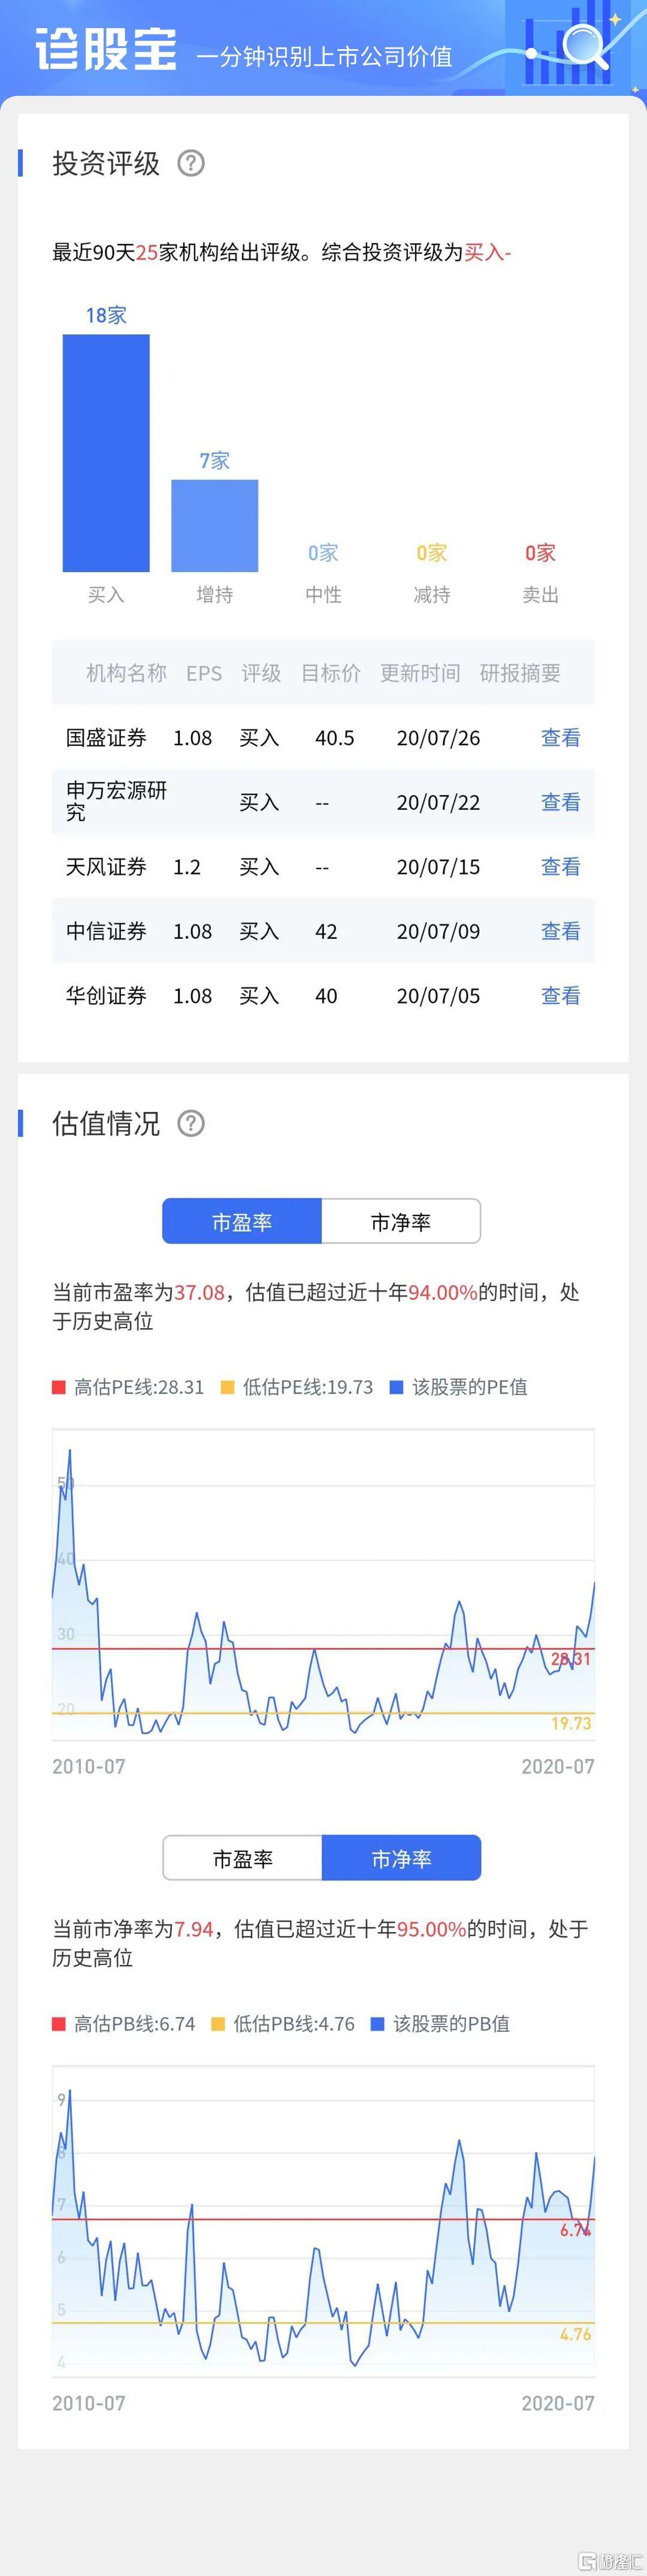
第三,估值。目前整個乳業板塊的市盈率TTM為37.75,而食品加工板塊的市盈率TTM也有44.57%。伊利股份市盈率TTM則僅有37.08,若是不考慮給與龍頭股的溢價,這個估值也處在較為安全的區間。
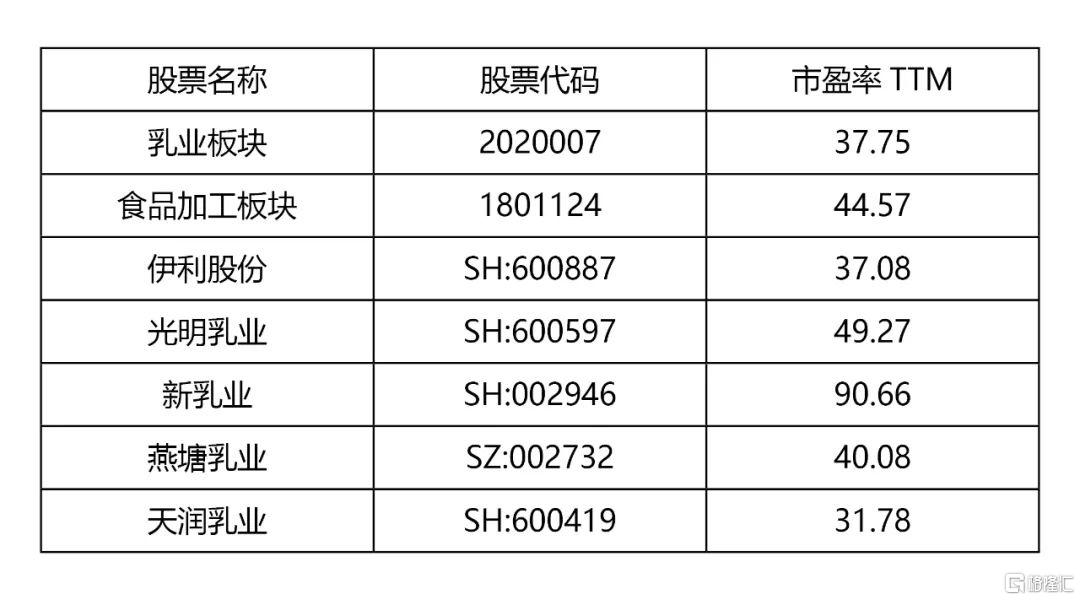
圖:乳業板塊行業內公司估值對比
目前公司擁有強大的渠道和產品力,且在低線市場擁有行業領先的渠道佈局,並積極推進產品結構升級,隨着產品銷售狀況逐漸回暖,伊利股份估值有望跟隨業績繼續增長。
綜上原因,上週,伊利股份即便受到大盤影響而短暫下跌,今天也能迅速的收回大部分失地。
投資者除了觀察股價表現,研究公司本身的"體質"也同樣重要。上週五大盤下跌後,我們看到部分個股就此一蹶不振,也可以看到部分個股很快的收復失地。正是因為中美摩擦的短期影響不改某些優秀標的的投資邏輯,股價才能迎來迅速的修復。
今天我們就用純數據的角度來分析乳業龍頭--伊利股份成色幾何?在診股寶全方位的掃描下,有沒把握收復高地,並繼續引領板塊向上突破?

免費診斷更多股票?認準格隆匯-診股寶

Follow us
Find us on
Facebook,
Twitter ,
Instagram, and
YouTube or frequent updates on all things investing.Have a financial topic you would like to discuss? Head over to the
uSMART Community to share your thoughts and insights about the market! Click the picture below to download and explore uSMART app!

Disclaimers
uSmart Securities Limited (“uSmart”) is based on its internal research and public third party information in preparation of this article. Although uSmart uses its best endeavours to ensure the content of this article is accurate, uSmart does not guarantee the accuracy, timeliness or completeness of the information of this article and is not responsible for any views/opinions/comments in this article. Opinions, forecasts and estimations reflect uSmart’s assessment as of the date of this article and are subject to change. uSmart has no obligation to notify you or anyone of any such changes. You must make independent analysis and judgment on any matters involved in this article. uSmart and any directors, officers, employees or agents of uSmart will not be liable for any loss or damage suffered by any person in reliance on any representation or omission in the content of this article. The content of the article is for reference only and does not constitute any offer, solicitation, recommendation, opinion or guarantee of any securities, virtual assets, financial products or instruments. Regulatory authorities may restrict the trading of virtual asset-related ETFs to only investors who meet specified requirements. Any calculations or images in the article are for illustrative purposes only.
Investment involves risks and the value and income from securities may rise or fall. Past performance is not indicative of future performance. Please carefully consider your personal risk tolerance, and consult independent professional advice if necessary.


