奧佳華(002614.SZ):財務估值模型
勾股大數據-奧佳華財務估值模型(點擊下載)
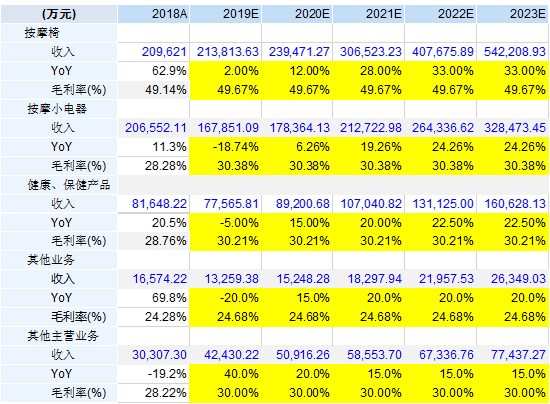
奧佳華目前主要有按摩椅、按摩小電器、健康及保健產品三大主營品類,考慮公司目前國外ODM及海外自主品牌業務穩步提升,國內業務(線上+經銷+直營)快速發展,國內行業仍處於導入階段(低集中度、低滲透度),我們認為奧佳華作為行業龍頭將迎來發展良機。本估值模型將以三大主營品類的銷售數據為預測基礎。
業務預測的思路如下:
(1)按摩椅:短期增長放緩,中長期需求快速回升。目前,我國家庭按摩椅滲透率低於1%,而2018年我國65歲以上人口占比達10.92%,2017年40%國內居民按摩椅消費能力已達標(人均可支配收入超4.5萬元以上),按摩保健需求有望促使按摩椅快速放量。受短期經濟下行影響,預計公司2019年增速下降到個位數,2020年增速開始回升,中長期增速整體維持20%以上。
(2)按摩小電器:短期增速下跌,中長期需求促使銷量快速回升。按摩小電器客單價低,受眾廣,受整體行業提速發展,預計公司在近兩年調整後,2020年增速開始回升,中長期增速整體穩定在20%左右。
(3)健康及保健產品:短期增長放緩,中長期快速回升。健康及保健產品主要是空氣淨化器、血壓儀、體温計等產品,需求大,公司過去歷史增速較高,預計公司2019年增速下滑,2020年增速回升,中長期增速整體穩定在20%左右。
(4)公司即將發行可轉債12億元,轉股時間有6年,預計轉股價格為24元,即將有5000萬股轉增股本(19年三季度末,公司股本5.6億股),每股收益有小幅稀釋。
各項業務營收增速及毛利假設如下:
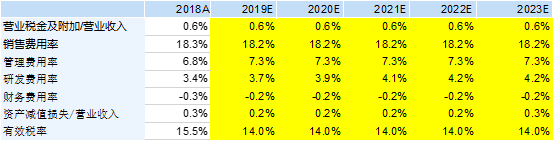
目前,按摩器械行業品牌認知度較低,預計未來幾年公司研發、品牌建設、銷售費用會持續投入,期間費用率整體有所提升,各項費用率假設如下:
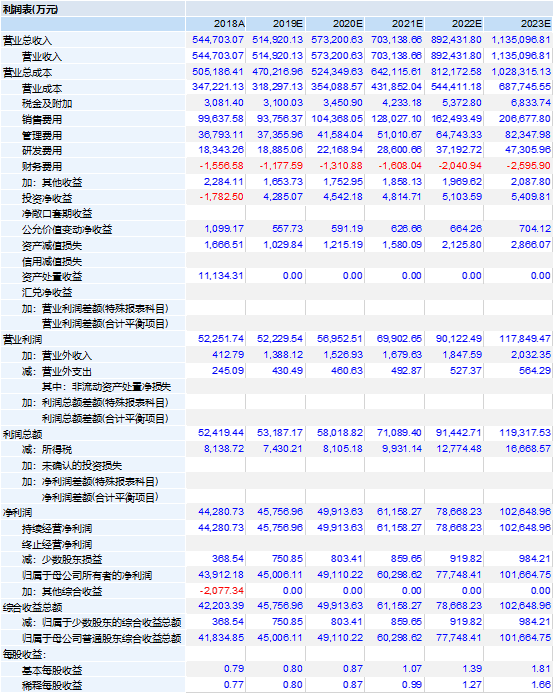
綜上,預計公司2019-2023年收入51.5/57.3/70.3/89.2/113.5億元,對應增速為-5.5%/11.3%/22.7%/26.9%/27.2%,歸母淨利潤為4.5/4.9/6.0/7.8/10.2億元,對應增速為2.5%/9.1%/22.8%/28.9%/30.8%。
公司預測利潤表如下:
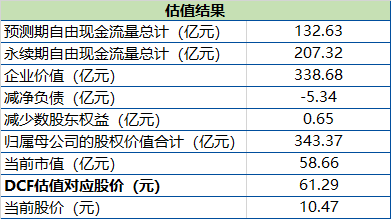
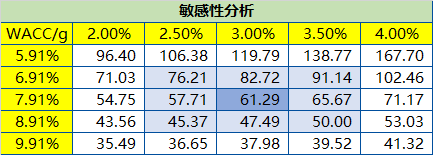
DCF估值假設:永續增長率為3.0%,無風險報酬率為3.18%,風險補償率為6.5%,則WACC為7.91%。根據敏感性分析得出估值區間為45.37-91.14元,對應2019年預測收益為56.59倍-113.68倍PE,高PE的主要是我們採用較為樂觀的業務增速,預期產生較多的企業自由現金流。根據目前最新股價,奧佳華市場價格相對其內在價值已經摺價約80%。
本模型展示了我們對於奧佳華未來發展的一種理解,不作為任何投資依據。各位用户可根據自己對公司發展的推測,自行設置參數調整估值模型。
利益聲明:本文所有分析僅為分享交流,並不構成對具體證券的買賣建議,不代表任何機構利益,同時可能存在觀點有偏情況,僅供參考。各位讀者需慎重考慮文中分析是否符合自身特定狀況,自主作出投資決策並自行承擔投資風險。
Follow us
Find us on
Facebook,
Twitter ,
Instagram, and
YouTube or frequent updates on all things investing.Have a financial topic you would like to discuss? Head over to the
uSMART Community to share your thoughts and insights about the market! Click the picture below to download and explore uSMART app!

Disclaimers
uSmart Securities Limited (“uSmart”) is based on its internal research and public third party information in preparation of this article. Although uSmart uses its best endeavours to ensure the content of this article is accurate, uSmart does not guarantee the accuracy, timeliness or completeness of the information of this article and is not responsible for any views/opinions/comments in this article. Opinions, forecasts and estimations reflect uSmart’s assessment as of the date of this article and are subject to change. uSmart has no obligation to notify you or anyone of any such changes. You must make independent analysis and judgment on any matters involved in this article. uSmart and any directors, officers, employees or agents of uSmart will not be liable for any loss or damage suffered by any person in reliance on any representation or omission in the content of this article. The content of the article is for reference only and does not constitute any offer, solicitation, recommendation, opinion or guarantee of any securities, virtual assets, financial products or instruments. Regulatory authorities may restrict the trading of virtual asset-related ETFs to only investors who meet specified requirements. Any calculations or images in the article are for illustrative purposes only.
Investment involves risks and the value and income from securities may rise or fall. Past performance is not indicative of future performance. Please carefully consider your personal risk tolerance, and consult independent professional advice if necessary.


