呷哺呷哺 ( 00520.HK) :调整后净利润略逊预期,凑凑表现超预期,维持“买入”评级,目标价12.7港币
机构:申万宏源
评级:买入
目标价:12.7港币
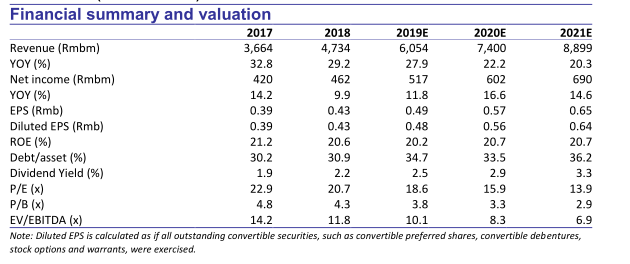
呷哺呷哺19年上半年收入同比增长27.4%至人民币27亿元,高于我们的预期,主要由于湊湊的收入超预期。净利润同比下滑22.5%至1.62亿元;国际财务报告准则第16号的实施导致净利润减少4300万元,不考虑会计调整的影响及IPO前股份奖励计划相关的开支,调整后净利润同比减少2.0%至2.1亿元,略低于我们的预期,主要因为员工成本高于预期。我们将19年稀释每股盈利预测从0.49元略微下调至0.48元(同比增长11.8%),维持20年稀释每股盈利预测0.56元(同比增长16.6%),维持21年稀释每股盈利预测0.64元(同比增长14.6%)。目标价从12.8港币略微下调至12.7港币,对应21.0%的上涨空间,维持买入建议。
门店扩张潜力。上半年公司新开76家的呷哺呷哺店(由于商业原因关闭了7家)和13家湊湊店,呷哺呷哺和湊湊的总门店数量分别达到955家和61家。管理层预计未来三年每年新开200家呷哺呷哺和湊湊门店。管理层在业绩会上称,根据聘请的顾问公司做的市场调研,按照人口数量计算,呷哺在内地的开店空间有5000多家,而按照商圈数量计算,空间有6000多家。湊湊的开店空间有1000多家。
呷哺品牌的同店下滑符合我们的预期。上半年呷哺品牌的同店销售同比下滑1.9%,跌幅较18年下半年的3%有所收窄。我们预计同店销售增速将在19年下半年转正,19全年预计为低单位数。同店增长将主来自门店升级带来的产品结构调整(截至19年中超过700家门店是2.0升级门店),茶饮的更多贡献,以及外卖业务的贡献(截至19年中73个城市的597家门店有外卖业务)。
湊湊的表现超预期。湊湊的收入同比增长150%至4.9亿元,贡献公司总收入的17%,超出我们的预期。餐饮层面营业利润率提升2个百分点至14%,高于我们的预期。管理层在业绩会上提到湊湊在19年上半年录得高双位数的同店销售增长率,湊湊的毛利率比呷哺呷哺高出3%。
利润压力。上半年,原材料成本得到良好控制,毛利率上涨0.4个百分点至63.3%。员工成本占收入的比例增加1.2个百分点至26.5%。租金成本占收入的比例(不包括IFRS16号会计准则调整的影响)也有所增加。净利润率(不包括IFRS16号会计准则调整的影响)下降2.3个百分点至7.6%。
维持买入。我们长期看好公司的门店扩张潜力,管理团队的创新能力,和湊湊的发展潜力。目标价从12.8港币略微下调至12.7港币,对应21.0%的上涨空间,维持买入建议。
Follow us
Find us on
Facebook,
Twitter ,
Instagram, and
YouTube or frequent updates on all things investing.Have a financial topic you would like to discuss? Head over to the
uSMART Community to share your thoughts and insights about the market! Click the picture below to download and explore uSMART app!

Disclaimers
uSmart Securities Limited (“uSmart”) is based on its internal research and public third party information in preparation of this article. Although uSmart uses its best endeavours to ensure the content of this article is accurate, uSmart does not guarantee the accuracy, timeliness or completeness of the information of this article and is not responsible for any views/opinions/comments in this article. Opinions, forecasts and estimations reflect uSmart’s assessment as of the date of this article and are subject to change. uSmart has no obligation to notify you or anyone of any such changes. You must make independent analysis and judgment on any matters involved in this article. uSmart and any directors, officers, employees or agents of uSmart will not be liable for any loss or damage suffered by any person in reliance on any representation or omission in the content of this article. The content of the article is for reference only and does not constitute any offer, solicitation, recommendation, opinion or guarantee of any securities, virtual assets, financial products or instruments. Regulatory authorities may restrict the trading of virtual asset-related ETFs to only investors who meet specified requirements. Any calculations or images in the article are for illustrative purposes only.
Investment involves risks and the value and income from securities may rise or fall. Past performance is not indicative of future performance. Please carefully consider your personal risk tolerance, and consult independent professional advice if necessary.


