海尔电器(1169.HK)主业经营回升估值优势显著维持“推荐”评级
机构:招商证券
评级:推荐
主业回暖,终端将逐渐向出货端传导。洗衣机和热水器是海尔电器旗下两大 家电业务板块。洗衣机板块自 18H2 以来,行业内销出货增速明显放缓,2019 年 1-4 月洗衣机内销出货甚至出现同比下滑;直至 19.5-6 月,行业整体景气 有所复苏,内销出货量+8%/+7.2%(产业在线)。海尔洗衣机 Q2 销售情况 也有所改善,内销出货+0.8%/+6.9%;终端销售(中怡康线下) +11.8%/+4.6%, 终端改善早于出货。热水器方面,2019.6 零售量同比增速也已转正,海尔 5-6 月单月零售量 YoY+12.8%/+6.8%,领先于行业更早复苏。
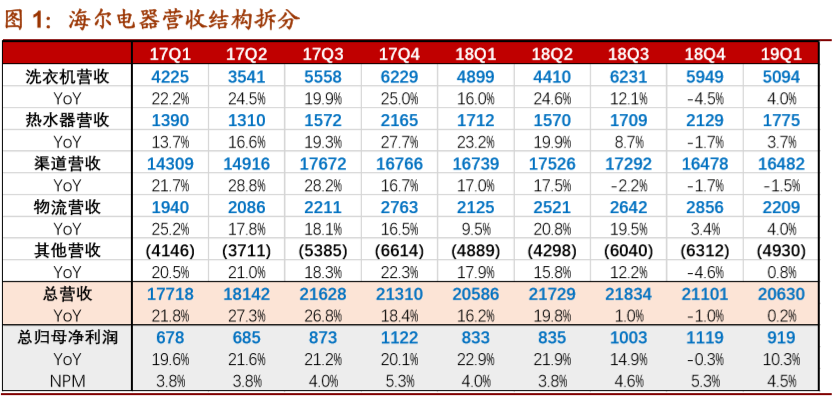
1)洗衣机:18Q4、19Q1 海尔洗衣机业务收入 YoY-4.5%/+4%;19Q2,据 中怡康,海尔洗衣机市占率在 32%+,较去年同期提升 1.8pct; 4-6 月 ASP+3% /+8%/+9%,持续上涨,量价层面均呈良好趋势。
2)热水器:18Q4、19Q1 热水器收入 YoY-1.7%/+1.7%;19Q2,据中怡康, 海尔热水器月度平均市占率在 20%+,较去年同期提升 1pct+,竞争对手 A.O. 史密斯份额同期则同比下降;但 ASP 层面,海尔 Q2 均价 YoY-4.4%,故销 额层面预计 Q2 也仅为小幅改善。
3)分销&物流:分销、物流业务趋稳,对盈利影响有限;Q2 黑电、空调销售 景气弱,或将影响分销业务收入。依 2018 年报海尔电器分部收入、利润占比 初步测算,洗衣机/热水器/渠道分销/物流利润率分别为 9.8%/12.1%/1.9% /4.4%,物流、分销对公司盈利能力的影响有限。
更强的盈利能力,向好的经营趋势。2014-2018 年,海尔电器依托较高的产 品定位,持续优化产品结构,实现盈利能力的改善:毛利率从2014年的14.7%, 提高到 2018 年的 17.8%;净利率也由 3%提高到 4%;19Q1 在加大的经营压 力下仍然实现 4.5%的净利率,YoY+0.5pct。
估值优势显著。公司 Q1 总营收合计增长 0.2%,归母净利增长 10.3%,预计 Q2 收入端可能受黑电、空调的渠道业务而有所拖累;但考虑到零售端改善在 H2 将进一步向出货端传导,全年业绩仍然值得期待。据 wind 保守预计 19 年 净利润 41~42 亿(+8~10%),当前市值约 479 亿,18 年报账面净现金 190 亿,扣除现金后 19 年 PE 估值仅约 7x。
风险提示:消费品景气下行超预期、地产景气下行超预期
Follow us
Find us on
Facebook,
Twitter ,
Instagram, and
YouTube or frequent updates on all things investing.Have a financial topic you would like to discuss? Head over to the
uSMART Community to share your thoughts and insights about the market! Click the picture below to download and explore uSMART app!

Disclaimers
uSmart Securities Limited (“uSmart”) is based on its internal research and public third party information in preparation of this article. Although uSmart uses its best endeavours to ensure the content of this article is accurate, uSmart does not guarantee the accuracy, timeliness or completeness of the information of this article and is not responsible for any views/opinions/comments in this article. Opinions, forecasts and estimations reflect uSmart’s assessment as of the date of this article and are subject to change. uSmart has no obligation to notify you or anyone of any such changes. You must make independent analysis and judgment on any matters involved in this article. uSmart and any directors, officers, employees or agents of uSmart will not be liable for any loss or damage suffered by any person in reliance on any representation or omission in the content of this article. The content of the article is for reference only and does not constitute any offer, solicitation, recommendation, opinion or guarantee of any securities, virtual assets, financial products or instruments. Regulatory authorities may restrict the trading of virtual asset-related ETFs to only investors who meet specified requirements. Any calculations or images in the article are for illustrative purposes only.
Investment involves risks and the value and income from securities may rise or fall. Past performance is not indicative of future performance. Please carefully consider your personal risk tolerance, and consult independent professional advice if necessary.


