魔幻7月收官!阿根廷MERV牛冠全球,滬指3600仍在拉鋸
七月行情落下帷幕!
牛了一整個月的大盤,今日出現調整,滬指在3600點下方調整,全市場超4200只個股下跌,幾家歡喜幾家憂。
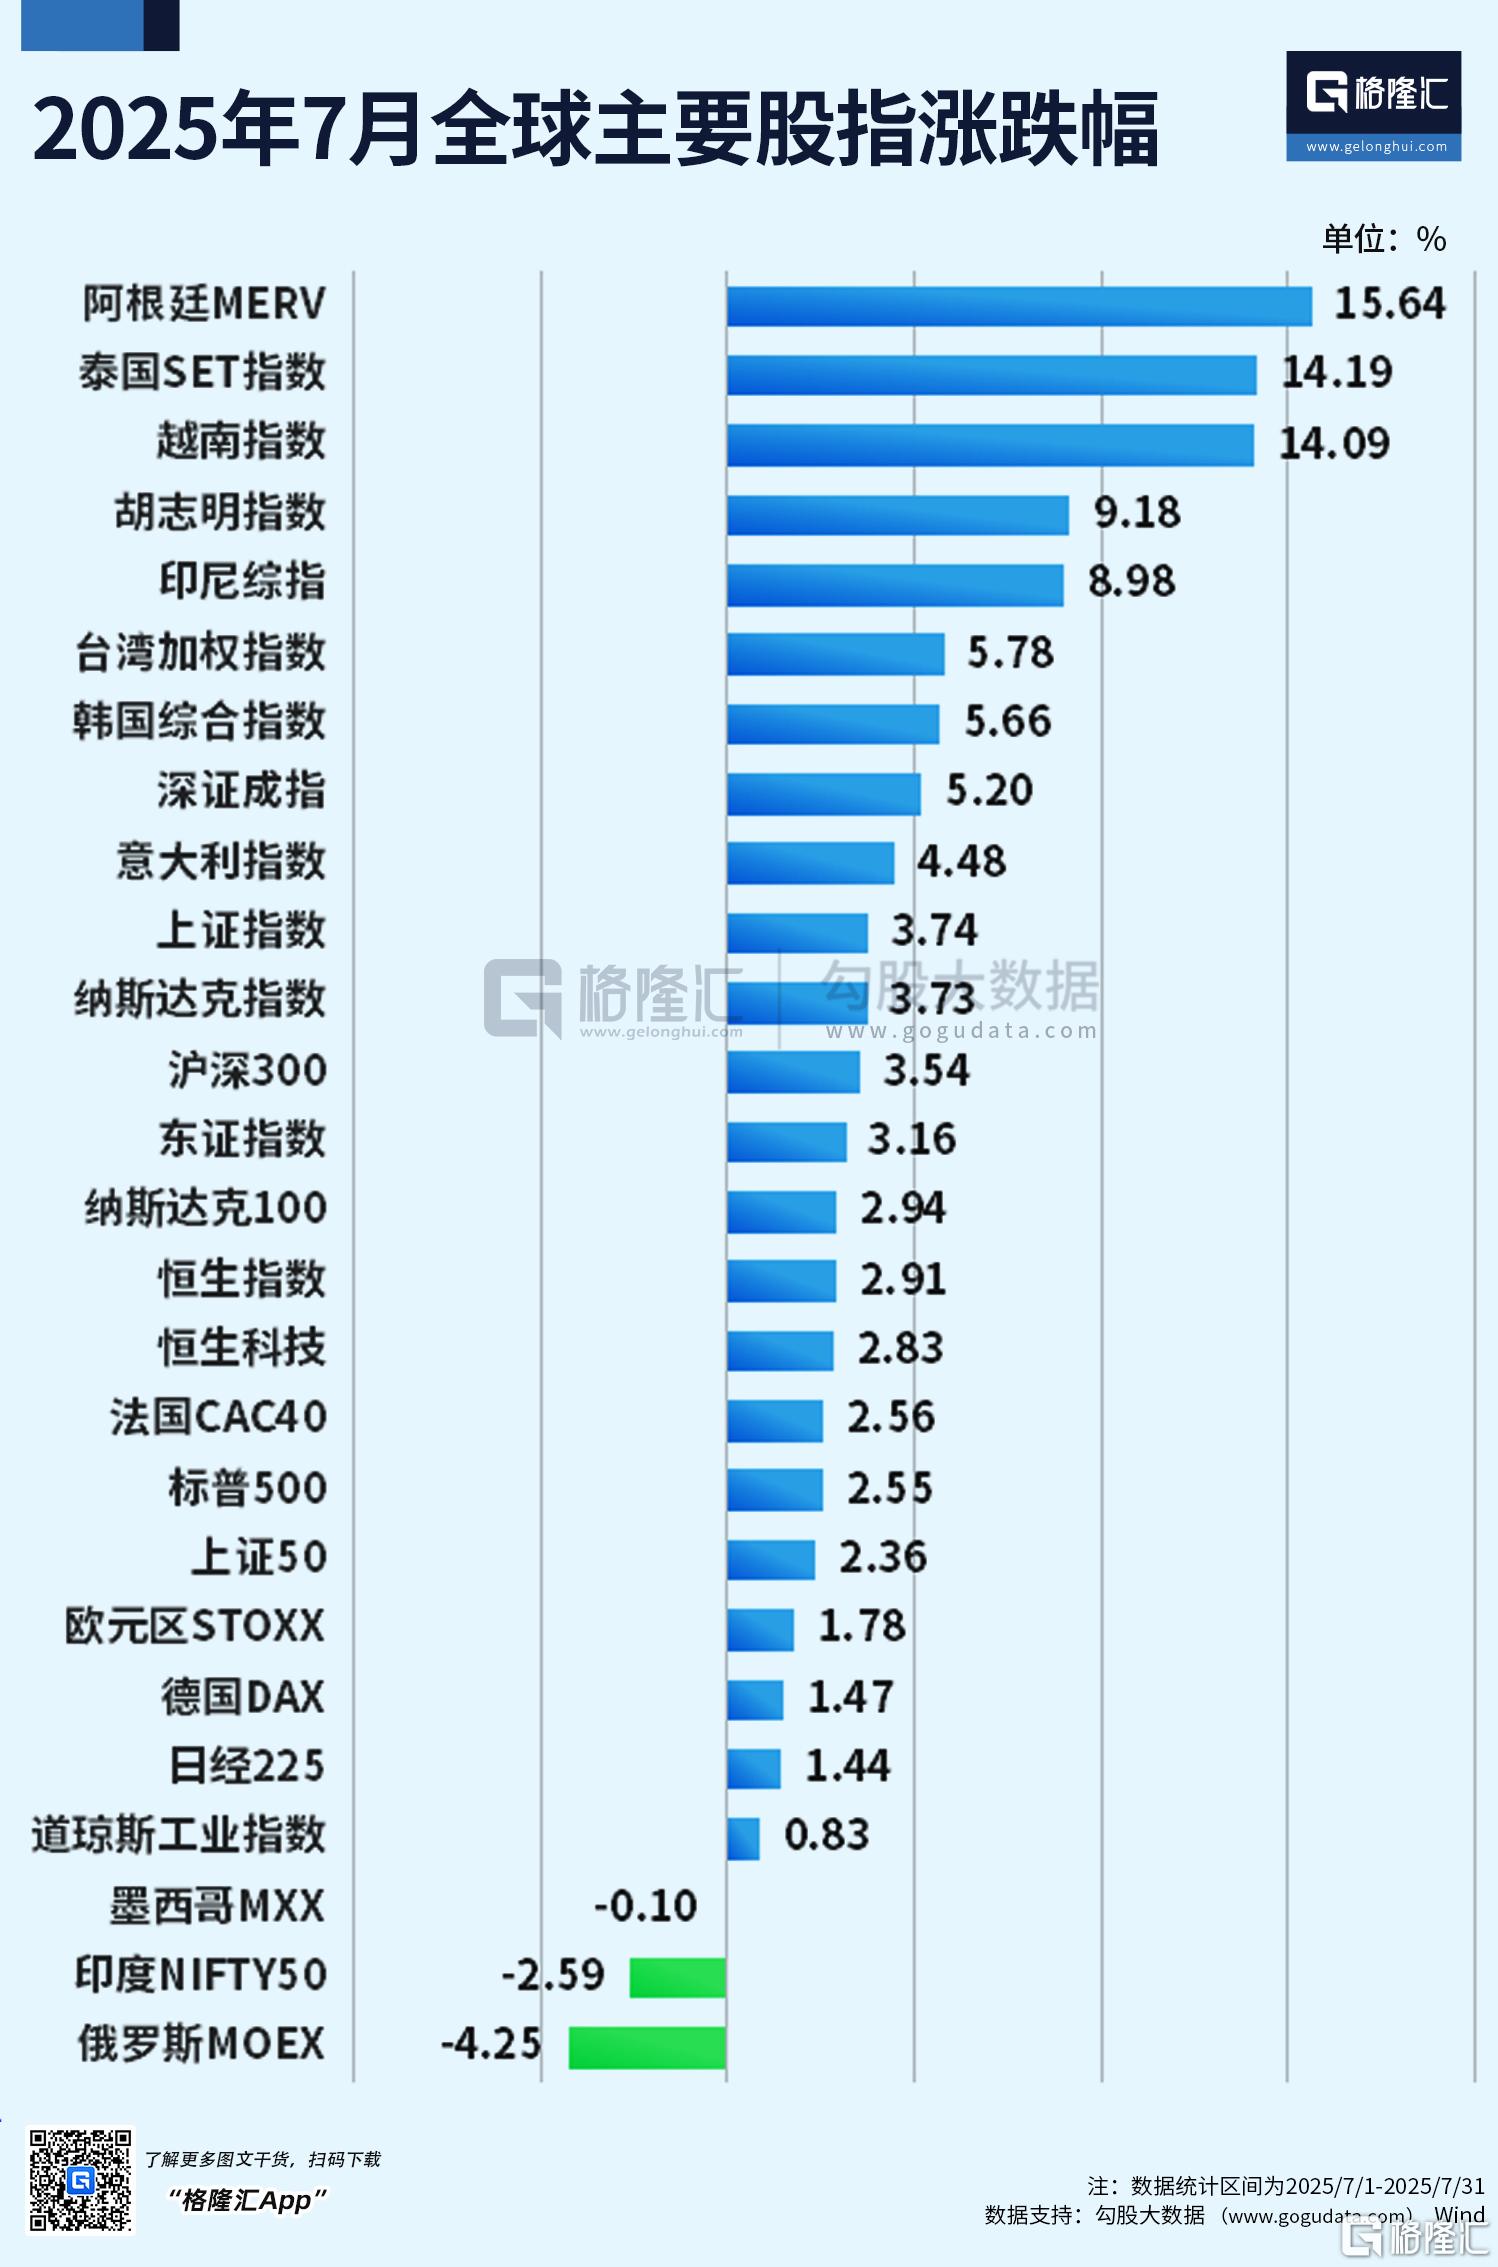
從全球主要市場的表現來看,阿根廷MERV 指數7月累漲15.64%,牛冠全球;泰國SET指數、越南指數緊隨其後,本月分別累漲14.19%、14.09%;另一方面,俄羅斯MOEX、印度NIFTY50、墨西哥MXX則爲表現最弱的三個市場。
A股在3600點來回拉扯
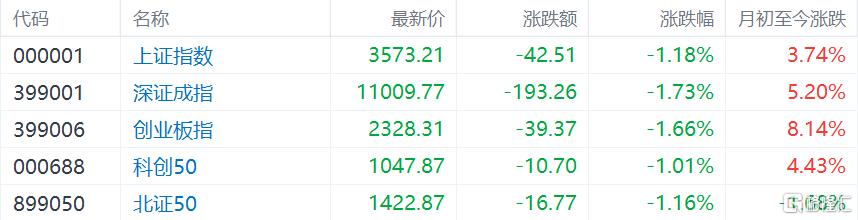
7月,A股市場呈現出震盪攀升的態勢,三大指數月線均收漲。其中,創業板指本月累計漲超8%,滬指在3600點處反覆拉鋸,本月累漲3.74%,深證成指累漲5.2%,而北證50卻跌1.68%。
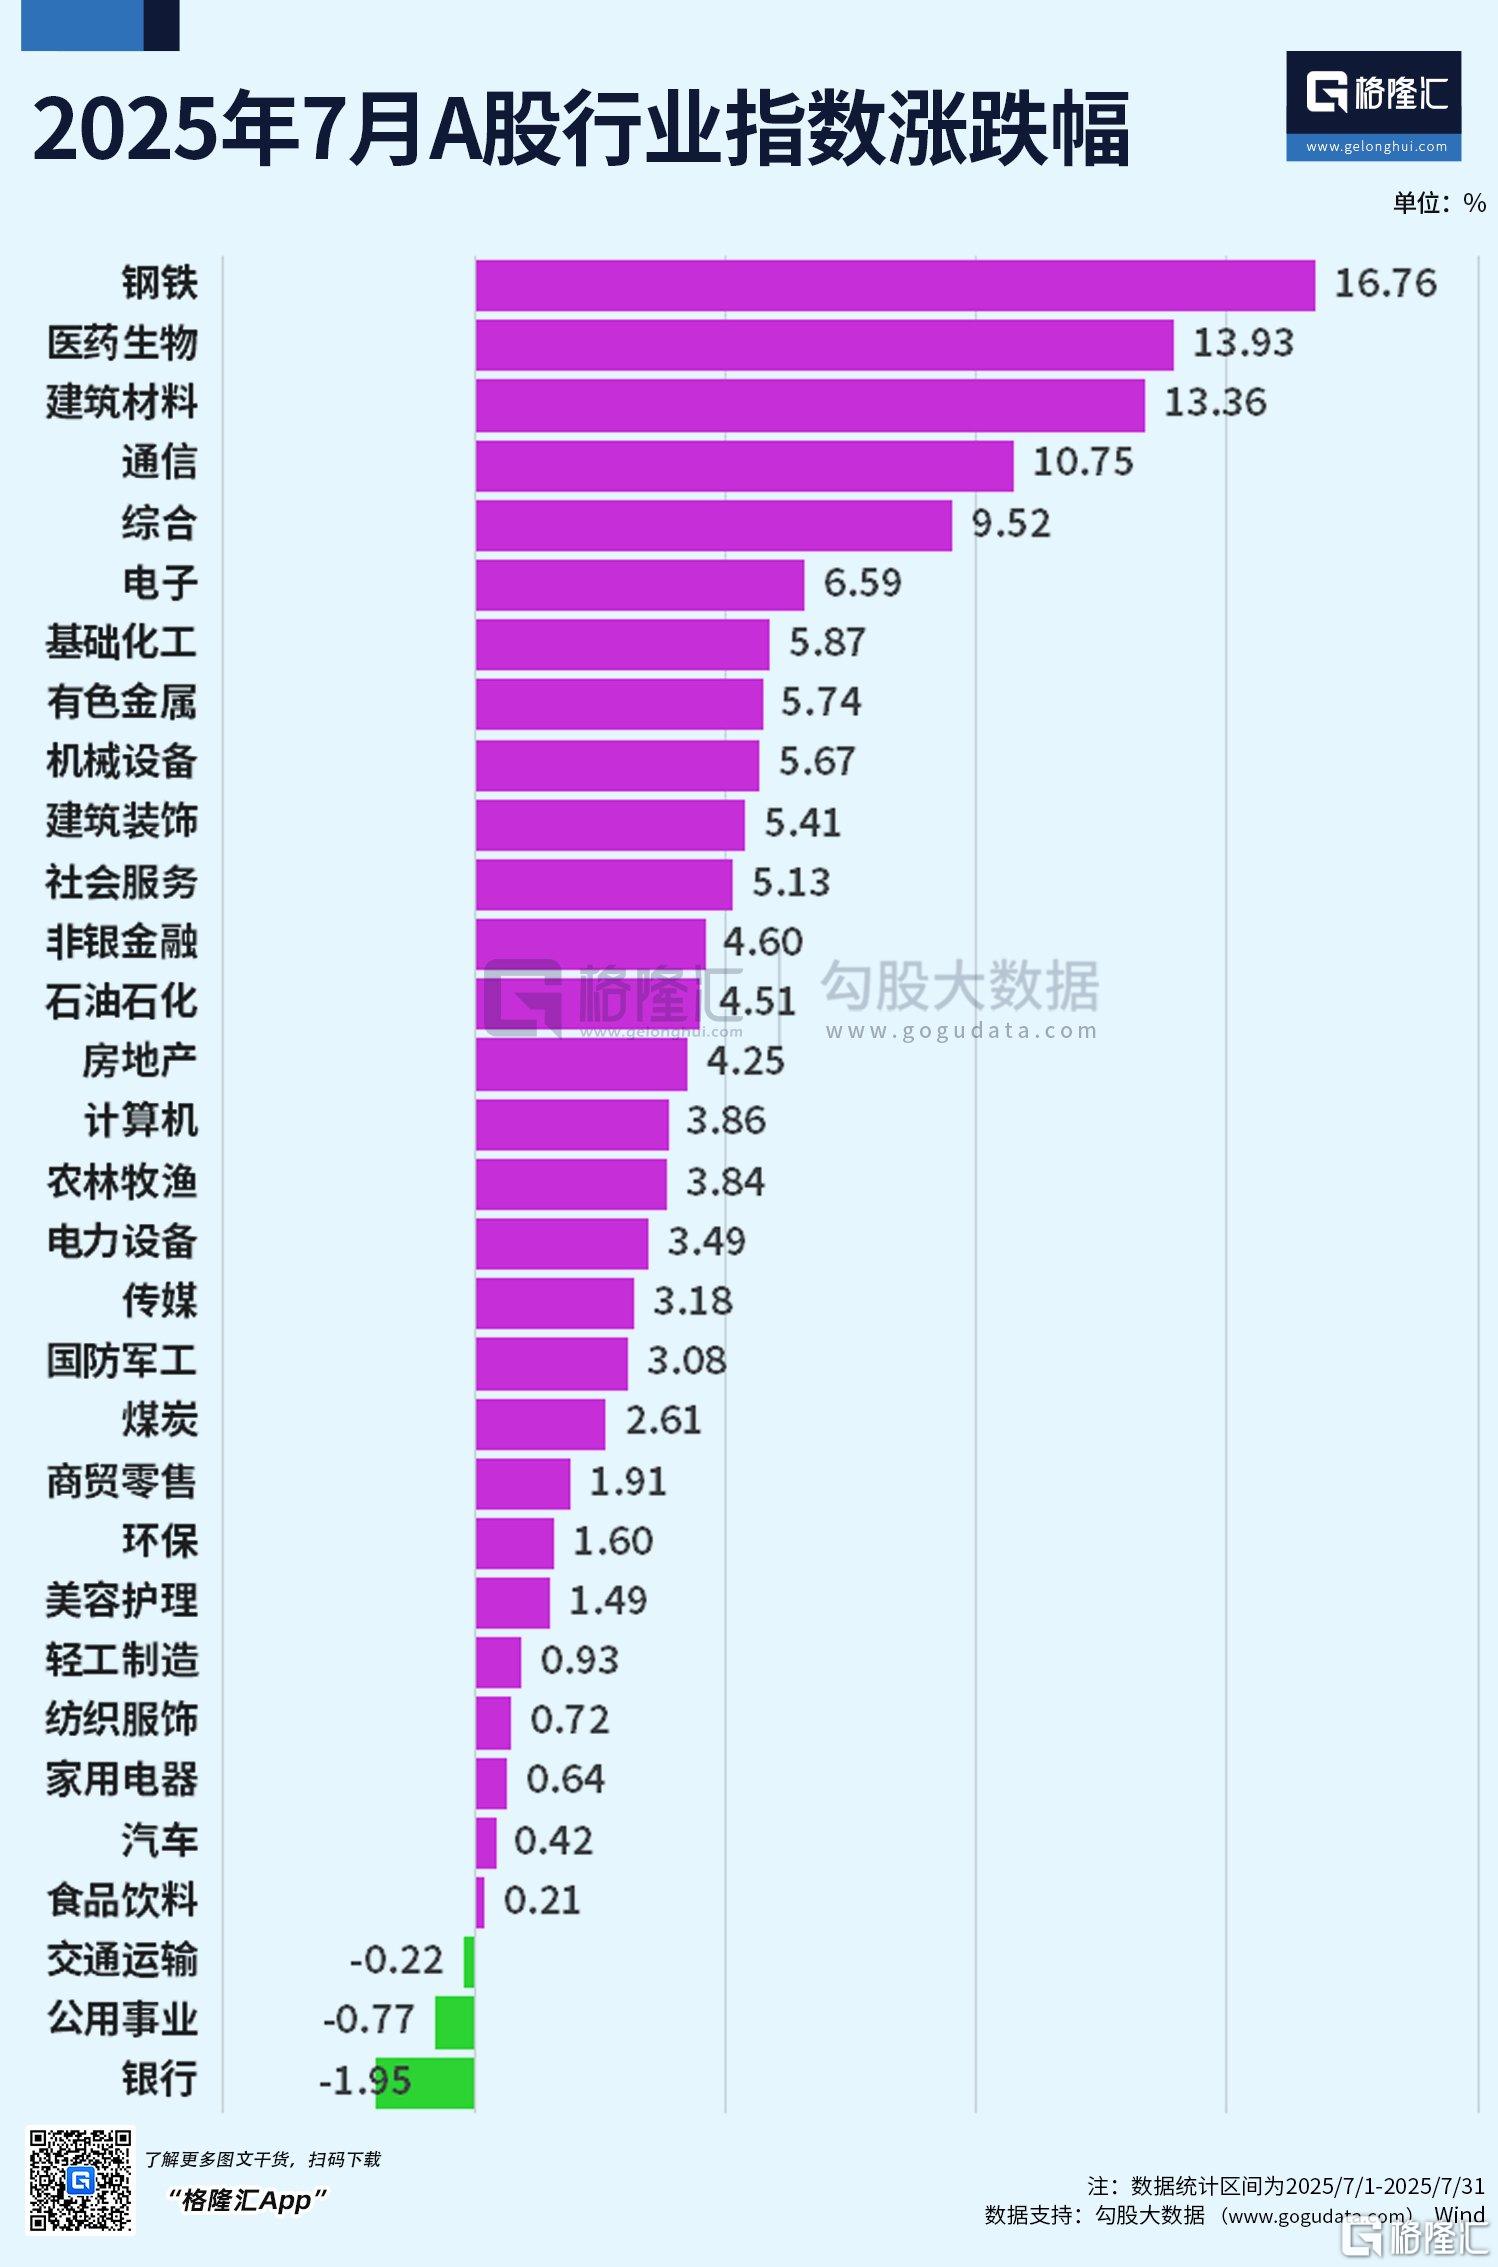
板塊方面,受反內卷政策持續催化影響,鋼鐵行業、建築材料、有色金屬等表現較好。銀行板塊以1.95%的跌幅位居跌幅榜第一,與公用事業(-0.77%)、交通運輸(-0.22%)成爲了7月僅有的3個下跌的板塊。
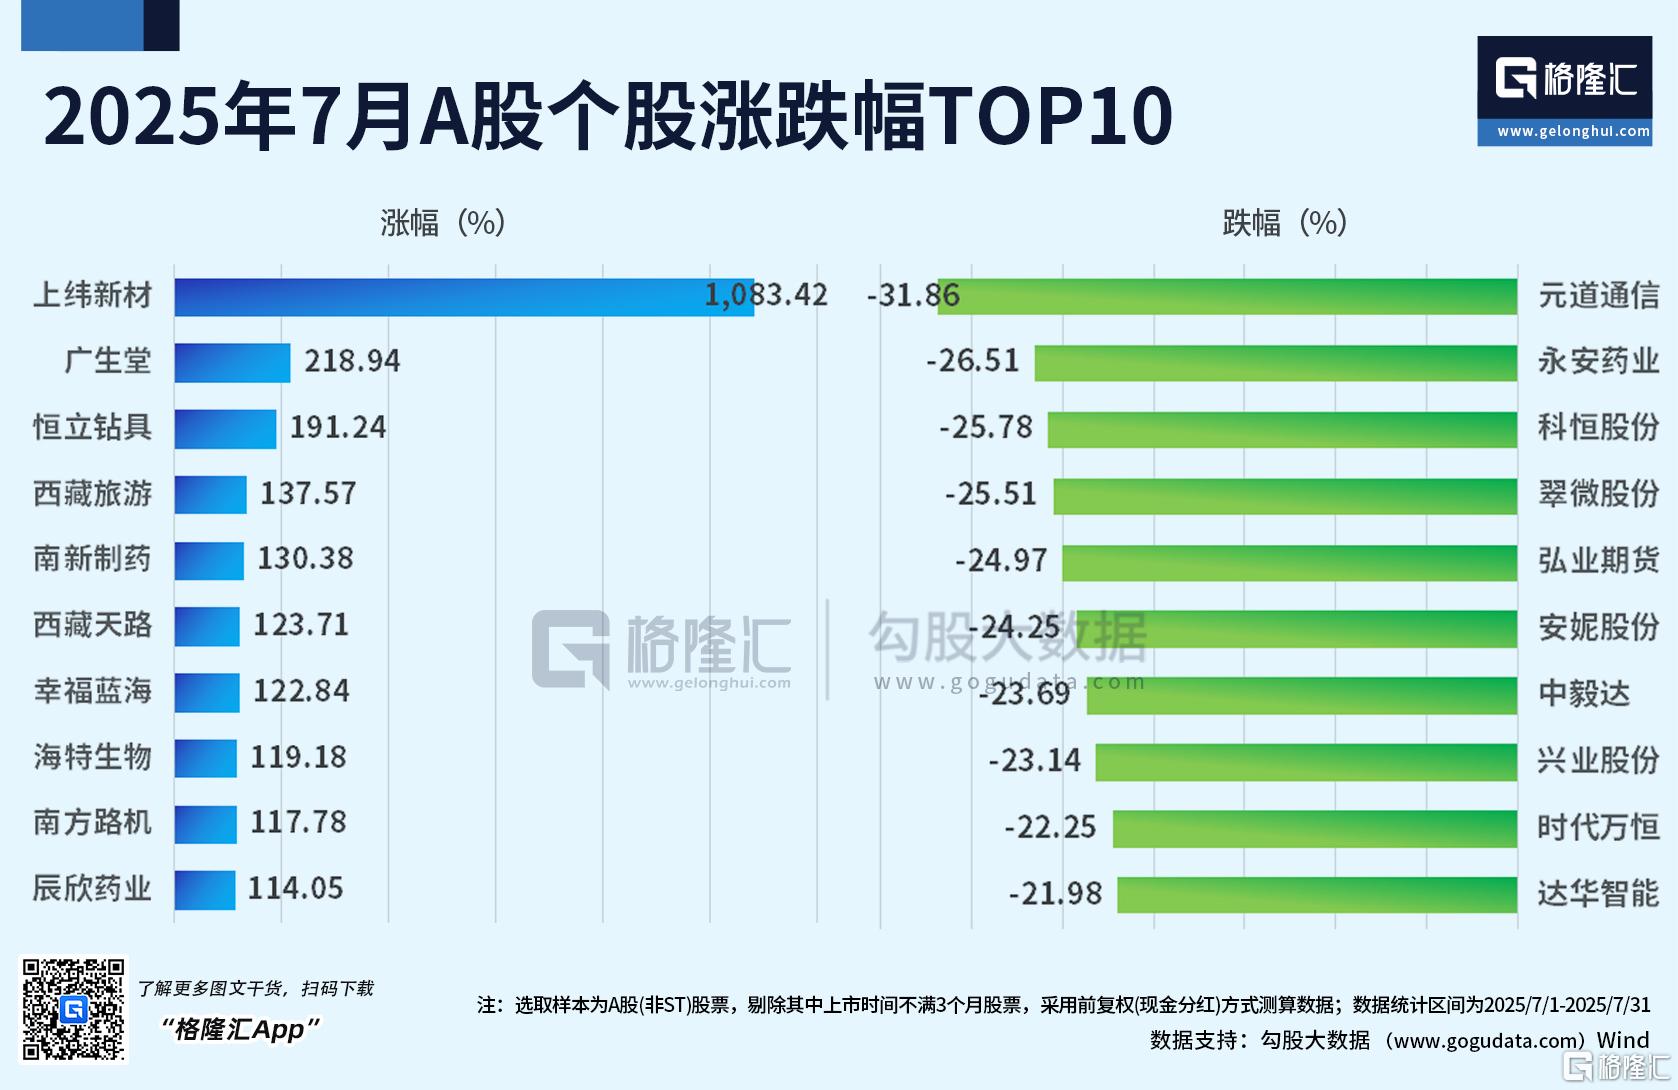
個股方面,7月漲幅前五的個股爲:上緯新材漲1083.42%、廣生堂漲218.94%、恆立鑽具漲191.24%、西藏旅遊漲137.57%、南新制藥漲130.38%。
跌幅前五的個股爲:元道通信跌31.86%、永安藥業跌26.51%、科恆股份跌25.78%、翠微股份跌25.15%、弘業期貨跌24.97%。
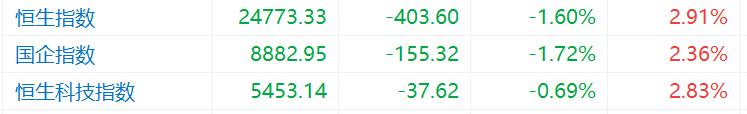
港股方面,7月受海外擾動緩和、國內風險偏好回暖等影響,三大指數呈現先揚後抑行情均錄得漲幅。本月恆指累漲2.91%,國指累漲2.36%,恆生科技指數累漲2.83%。從月線上看,恆生指數已經連續三個月上漲。
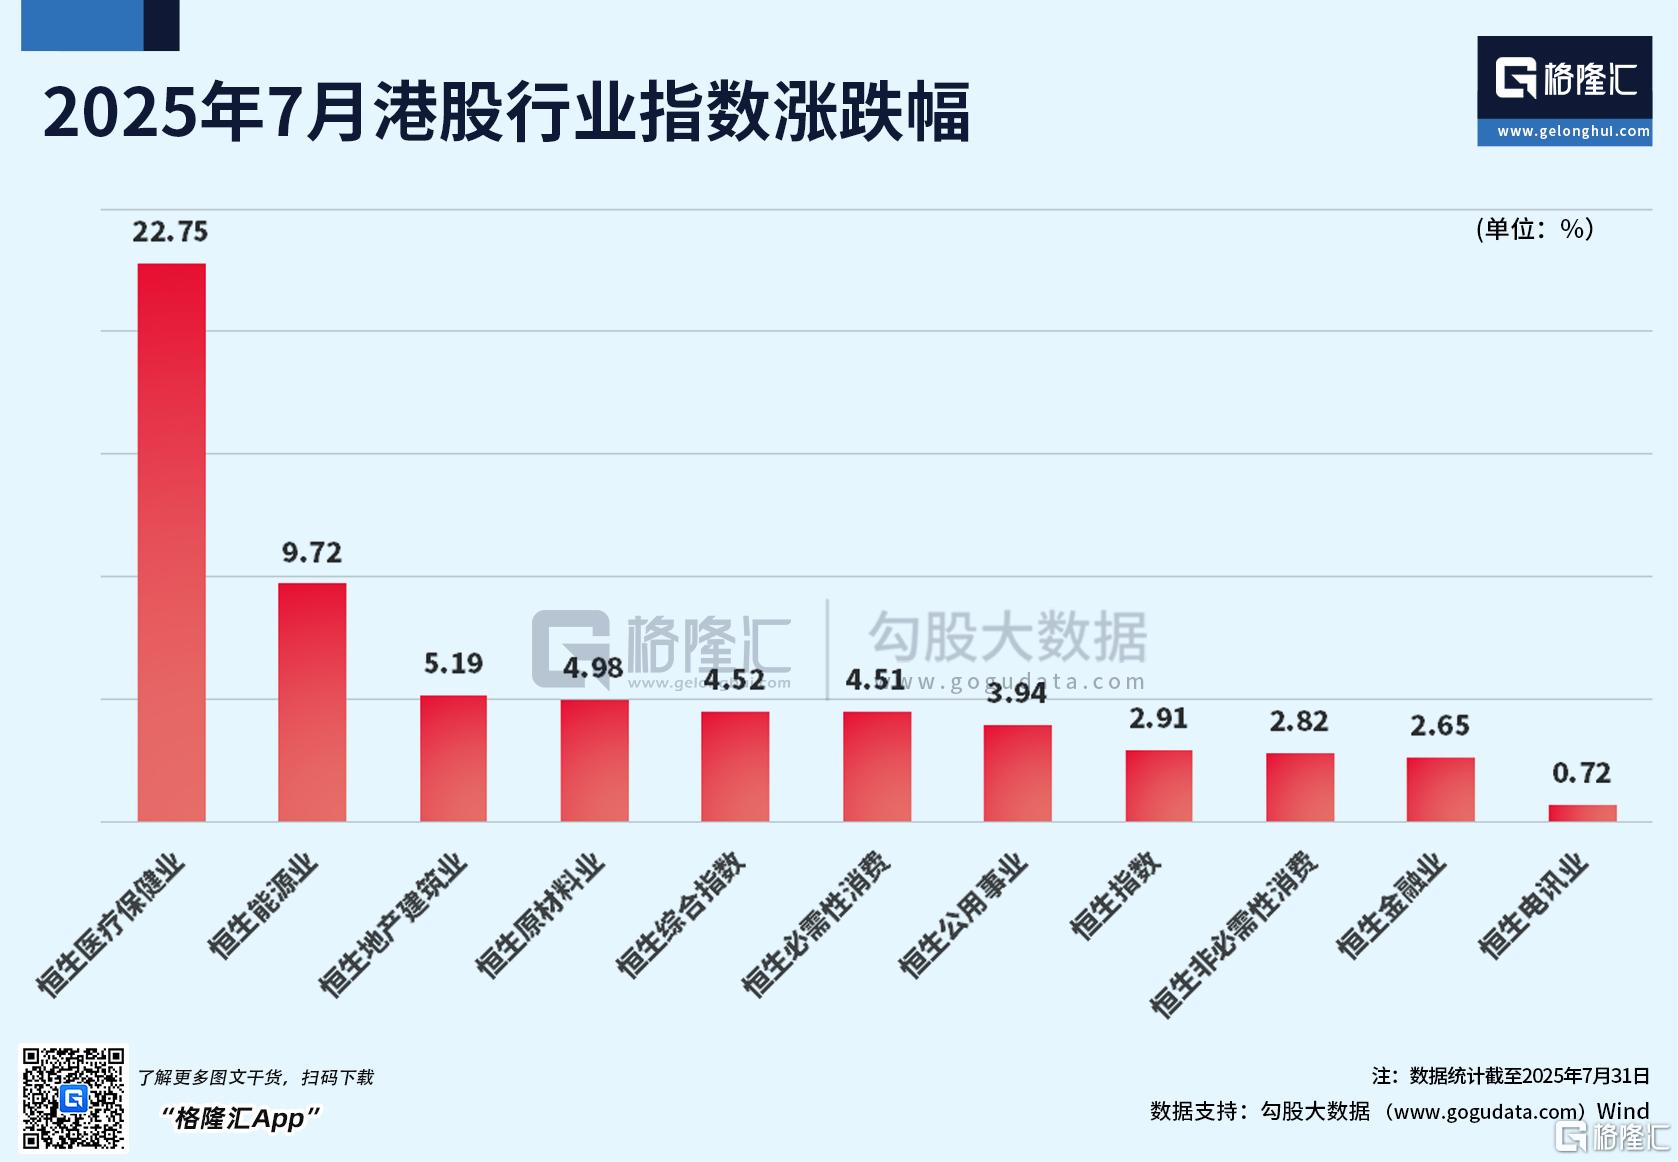
板塊方面,醫療保健、能源、地產建築、原材料行業漲幅靠前。
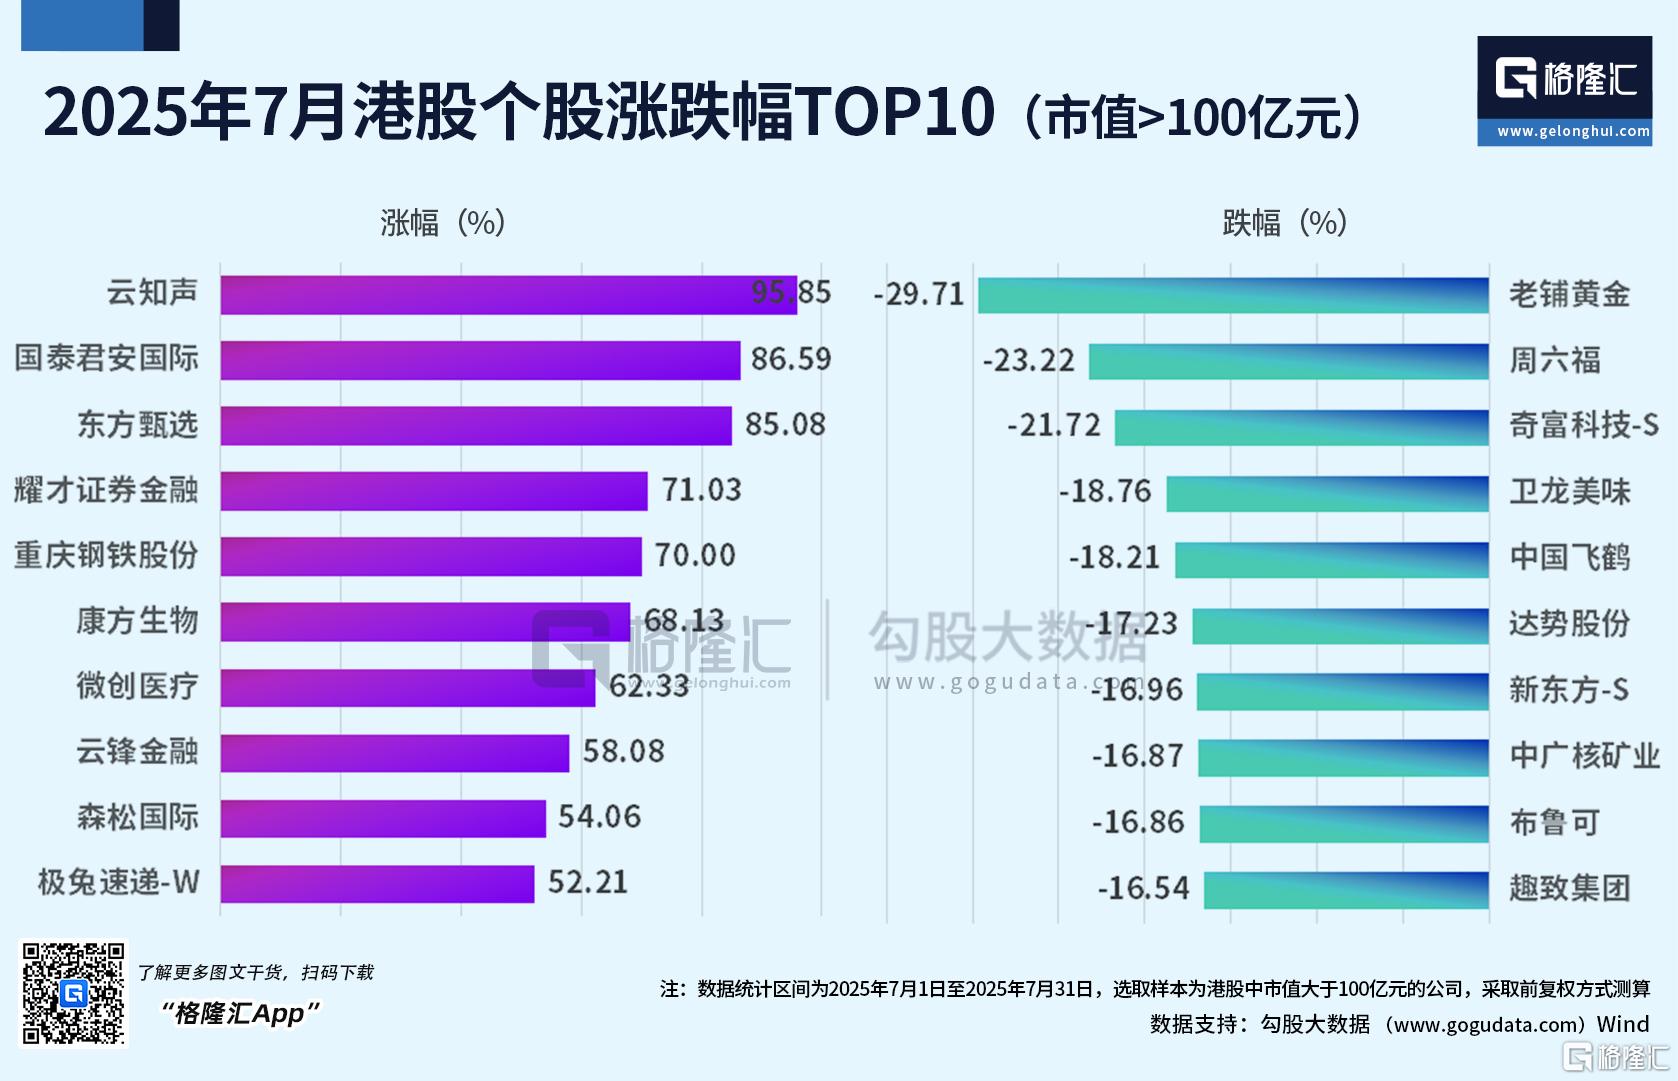
個股方面,7月漲幅前五的個股爲:雲知聲漲95.85%、國泰君安國際漲86.59%、東方甄選漲85.08%、耀才證券金融漲71.03%、重慶鋼鐵股份漲70%。
同期跌幅前五的個股爲:老鋪黃金跌29.71%、週六福跌23.22%、奇富科技-S跌21.72%、衛龍美味跌18.76%、中國飛鶴跌18.21%。
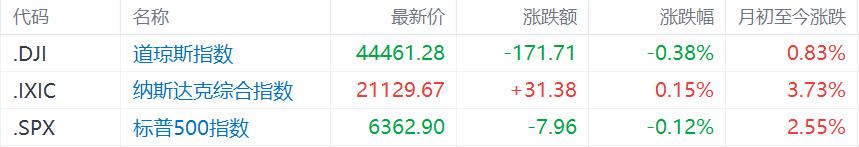
至於美股,截至目前三大指數月內齊漲,道指累漲0.83%,納指累漲3.73%,標普500指數累漲2.55%。
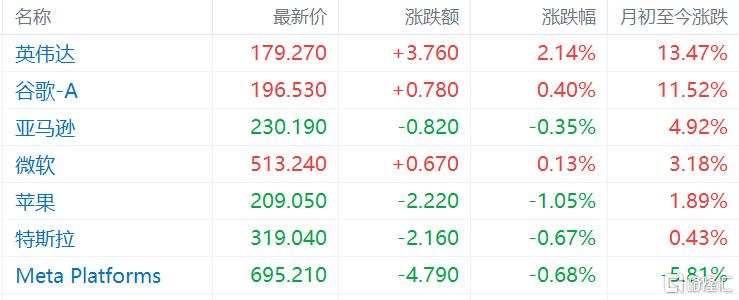
美國科技股七巨頭中,英偉達月內漲幅最大,累計漲超13%;谷歌累漲11.52%,亞馬遜累漲4.92%,微軟累漲3.18%;Meta Platforms則累跌5.81%。
後市怎麼看?
目前,多家券商都已先後發佈8月策略展望,他們紛紛表示看好A股後續行情。
國金證券指出,本輪上漲背後的核心驅動是對企業ROE見底回升的樂觀預期,而不僅是圍繞政策主題的炒作,因此伴隨盈利回升的兌現,市場將持續修復的趨勢。並且,當前A股估值儘管搶跑了基本面修復的節奏但並不極端,食品飲料、煤炭、石油石化等順週期行業的個股修復還處於早期階段。
光大證券也認爲,去年9月以來的市場行情已從政策驅動逐步轉向基本面與流動性驅動,未來市場行情演繹的節奏或可參照 2019 年。展望下半年,市場仍存在一些預期差,如短期基本面改善的持續性、資金持續流入及新興產業發展帶來的機遇等。因此,下半年市場將開啓下一階段上漲行情,並有望突破2024年下半年的階段性高點。
港股方面,光大證券表示,恆生指數已經突破前期高點,未來或繼續震盪上行。港股整體盈利能力相對較強,同時互聯網、新消費、創新藥等資產相對稀缺,結合當前估值仍偏低,長期配置性價比仍較高。近期恆生指數已經突破了前期高點,上漲阻力較小,在國內穩增長政策的持續發力下,港股市場未來或許將繼續震盪上行。
可關注科技成長及高股息佔優的“啞鈴”策略。1)關注中美大博弈背景下國內扶持政策有望持續出臺的自主可控、芯片、高端製造相關概念。2)關注具有自身獨立景氣度的部分互聯網科技公司。3)繼續關注高股息低波動策略,包括通信、公用事業、銀行等行業。高股息策略仍然可以作爲穩定收益的底倉。
Follow us
Find us on
Facebook,
Twitter ,
Instagram, and
YouTube or frequent updates on all things investing.Have a financial topic you would like to discuss? Head over to the
uSMART Community to share your thoughts and insights about the market! Click the picture below to download and explore uSMART app!

Disclaimers
uSmart Securities Limited (“uSmart”) is based on its internal research and public third party information in preparation of this article. Although uSmart uses its best endeavours to ensure the content of this article is accurate, uSmart does not guarantee the accuracy, timeliness or completeness of the information of this article and is not responsible for any views/opinions/comments in this article. Opinions, forecasts and estimations reflect uSmart’s assessment as of the date of this article and are subject to change. uSmart has no obligation to notify you or anyone of any such changes. You must make independent analysis and judgment on any matters involved in this article. uSmart and any directors, officers, employees or agents of uSmart will not be liable for any loss or damage suffered by any person in reliance on any representation or omission in the content of this article. The content of the article is for reference only and does not constitute any offer, solicitation, recommendation, opinion or guarantee of any securities, virtual assets, financial products or instruments. Regulatory authorities may restrict the trading of virtual asset-related ETFs to only investors who meet specified requirements. Any calculations or images in the article are for illustrative purposes only.
Investment involves risks and the value and income from securities may rise or fall. Past performance is not indicative of future performance. Please carefully consider your personal risk tolerance, and consult independent professional advice if necessary.


