2025上半年收官盤點:"穩定幣概念"飆升76%、港股IPO大爆發、泰指墊底
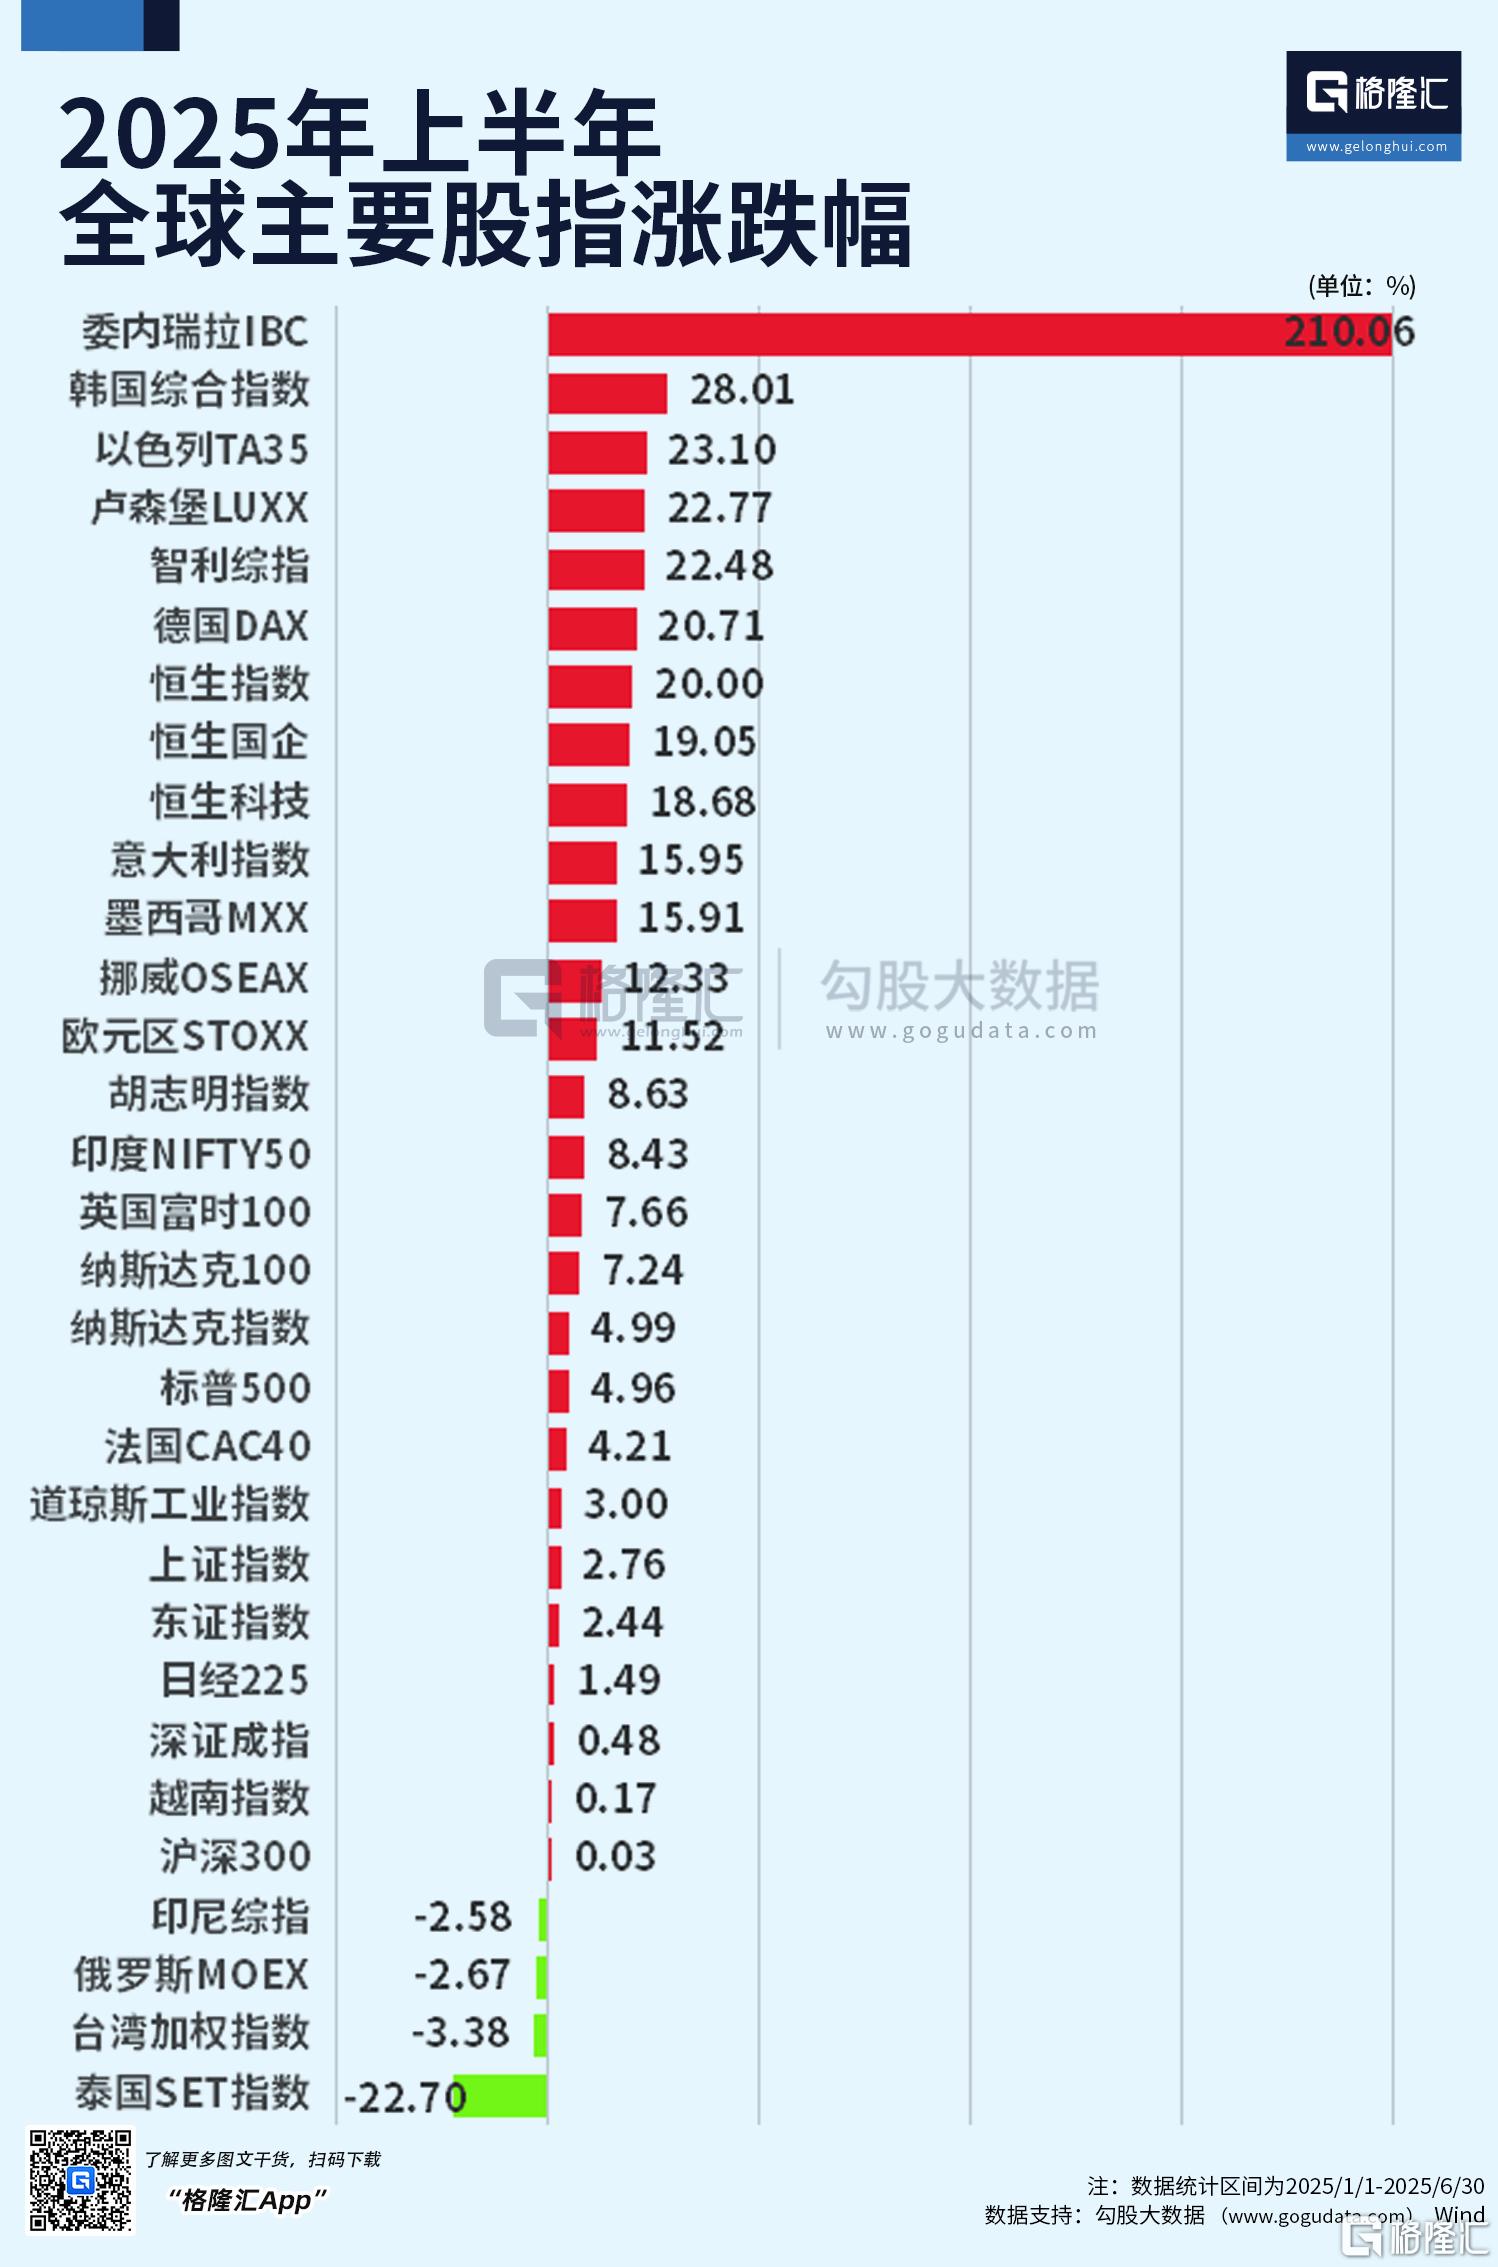
2025年上半年正式收官,從主要市場的整體表現來看,韓國綜合指數上半年累升28.01%,牛冠全球;以色列TA35以23.1%的升幅位居中東市場之首;其次是盧森堡LUXX、智利綜指、德國DAX和恒生指數,升幅均在20%以上,恒生國企指數和恒生科技指數分別累計升19.05%和18.68%,值得一提的是,港股三大指數上半年累計升幅均進入全球排名前十。另一邊,泰國SET指數以-22.7%的跌幅“墊底”。
接下來,小編從板塊、牛熊股、退市股、IPO募資金額變化等多維度,帶你一文縱覽港、A股市場脈動。
2025上半年A股畫像
A股三大指數6月份齊收升,滬指升2.9%報3444點,深證成指升4.23%報10465點,創業板指升8.02%報2153點。上半年,滬指升2.76%,深證成指升0.48%,創業板指升0.53%。
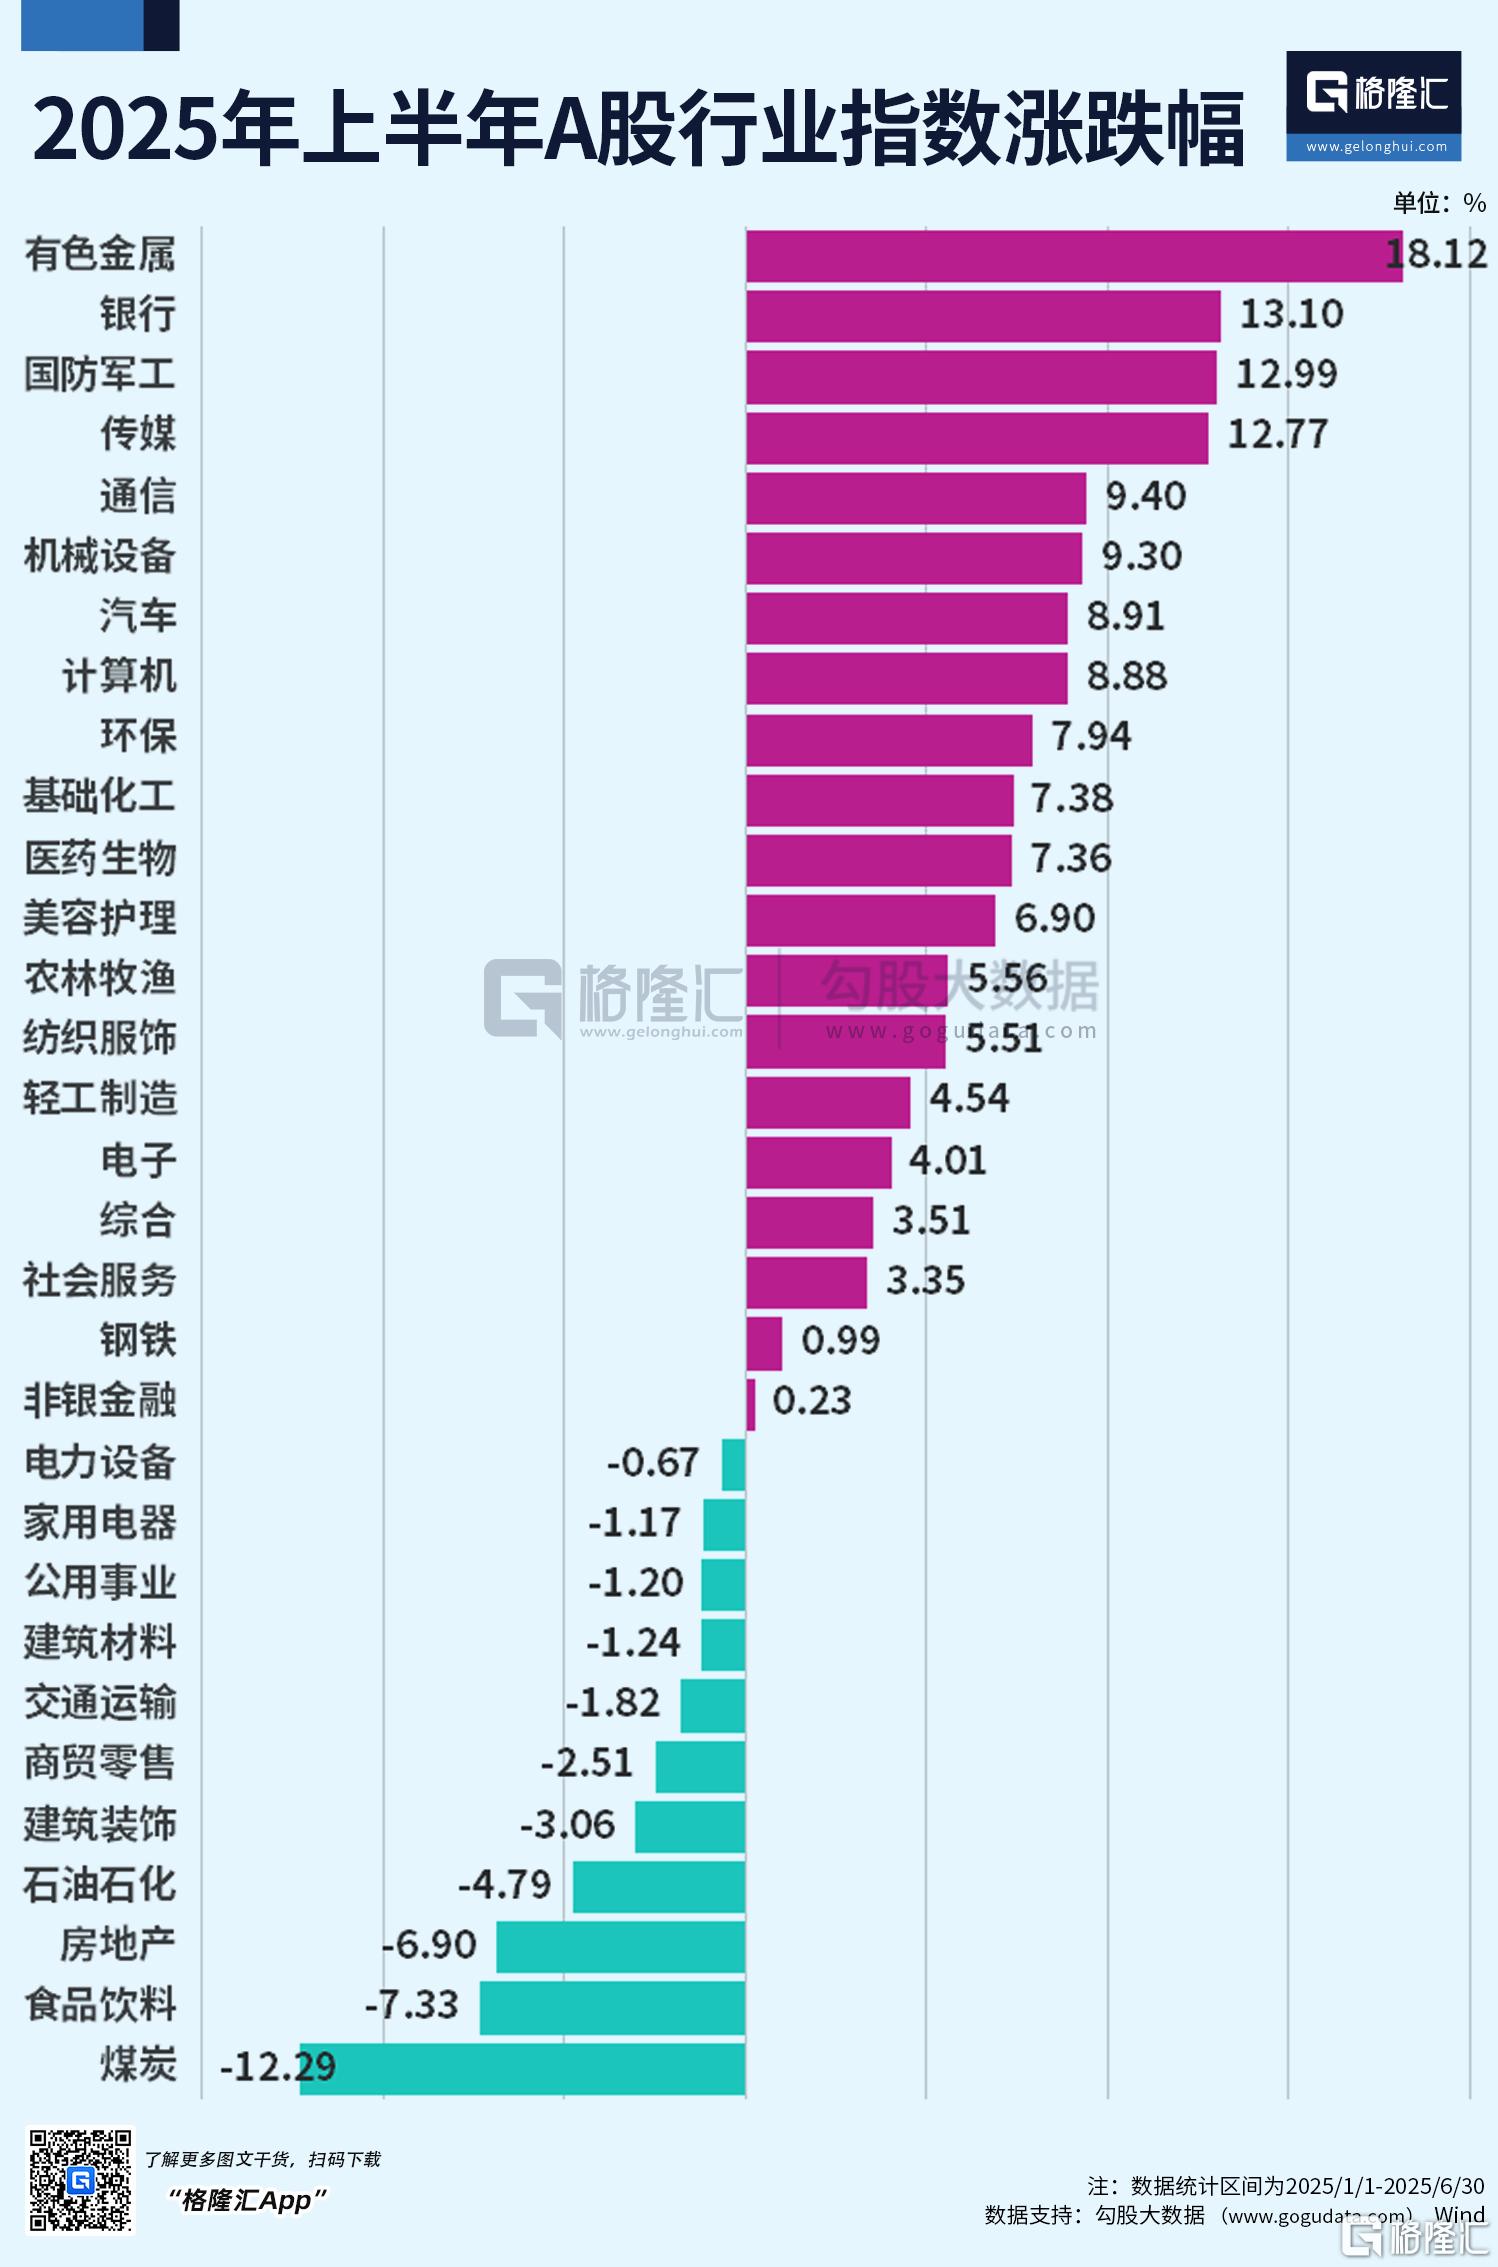
行業板塊方面,有色金屬、銀行、軍工、傳媒大放異彩,而地產、消費、煤炭等傳統行業卻集體“掉隊”。
在申萬31個一級行業中,上半年20個行業錄得正收益,11個行業錄得負收益。升幅前五的板塊為:有色金屬升18.12%、銀行升13.1%、國防軍工升12.99%、傳媒升12.77%、通信升9.4%;、跌幅前五的板塊為:煤炭跌12.29%、食品飲料跌7.33%、房地產跌6.9%、石油化工跌4.79%、建築裝飾跌3.06%。
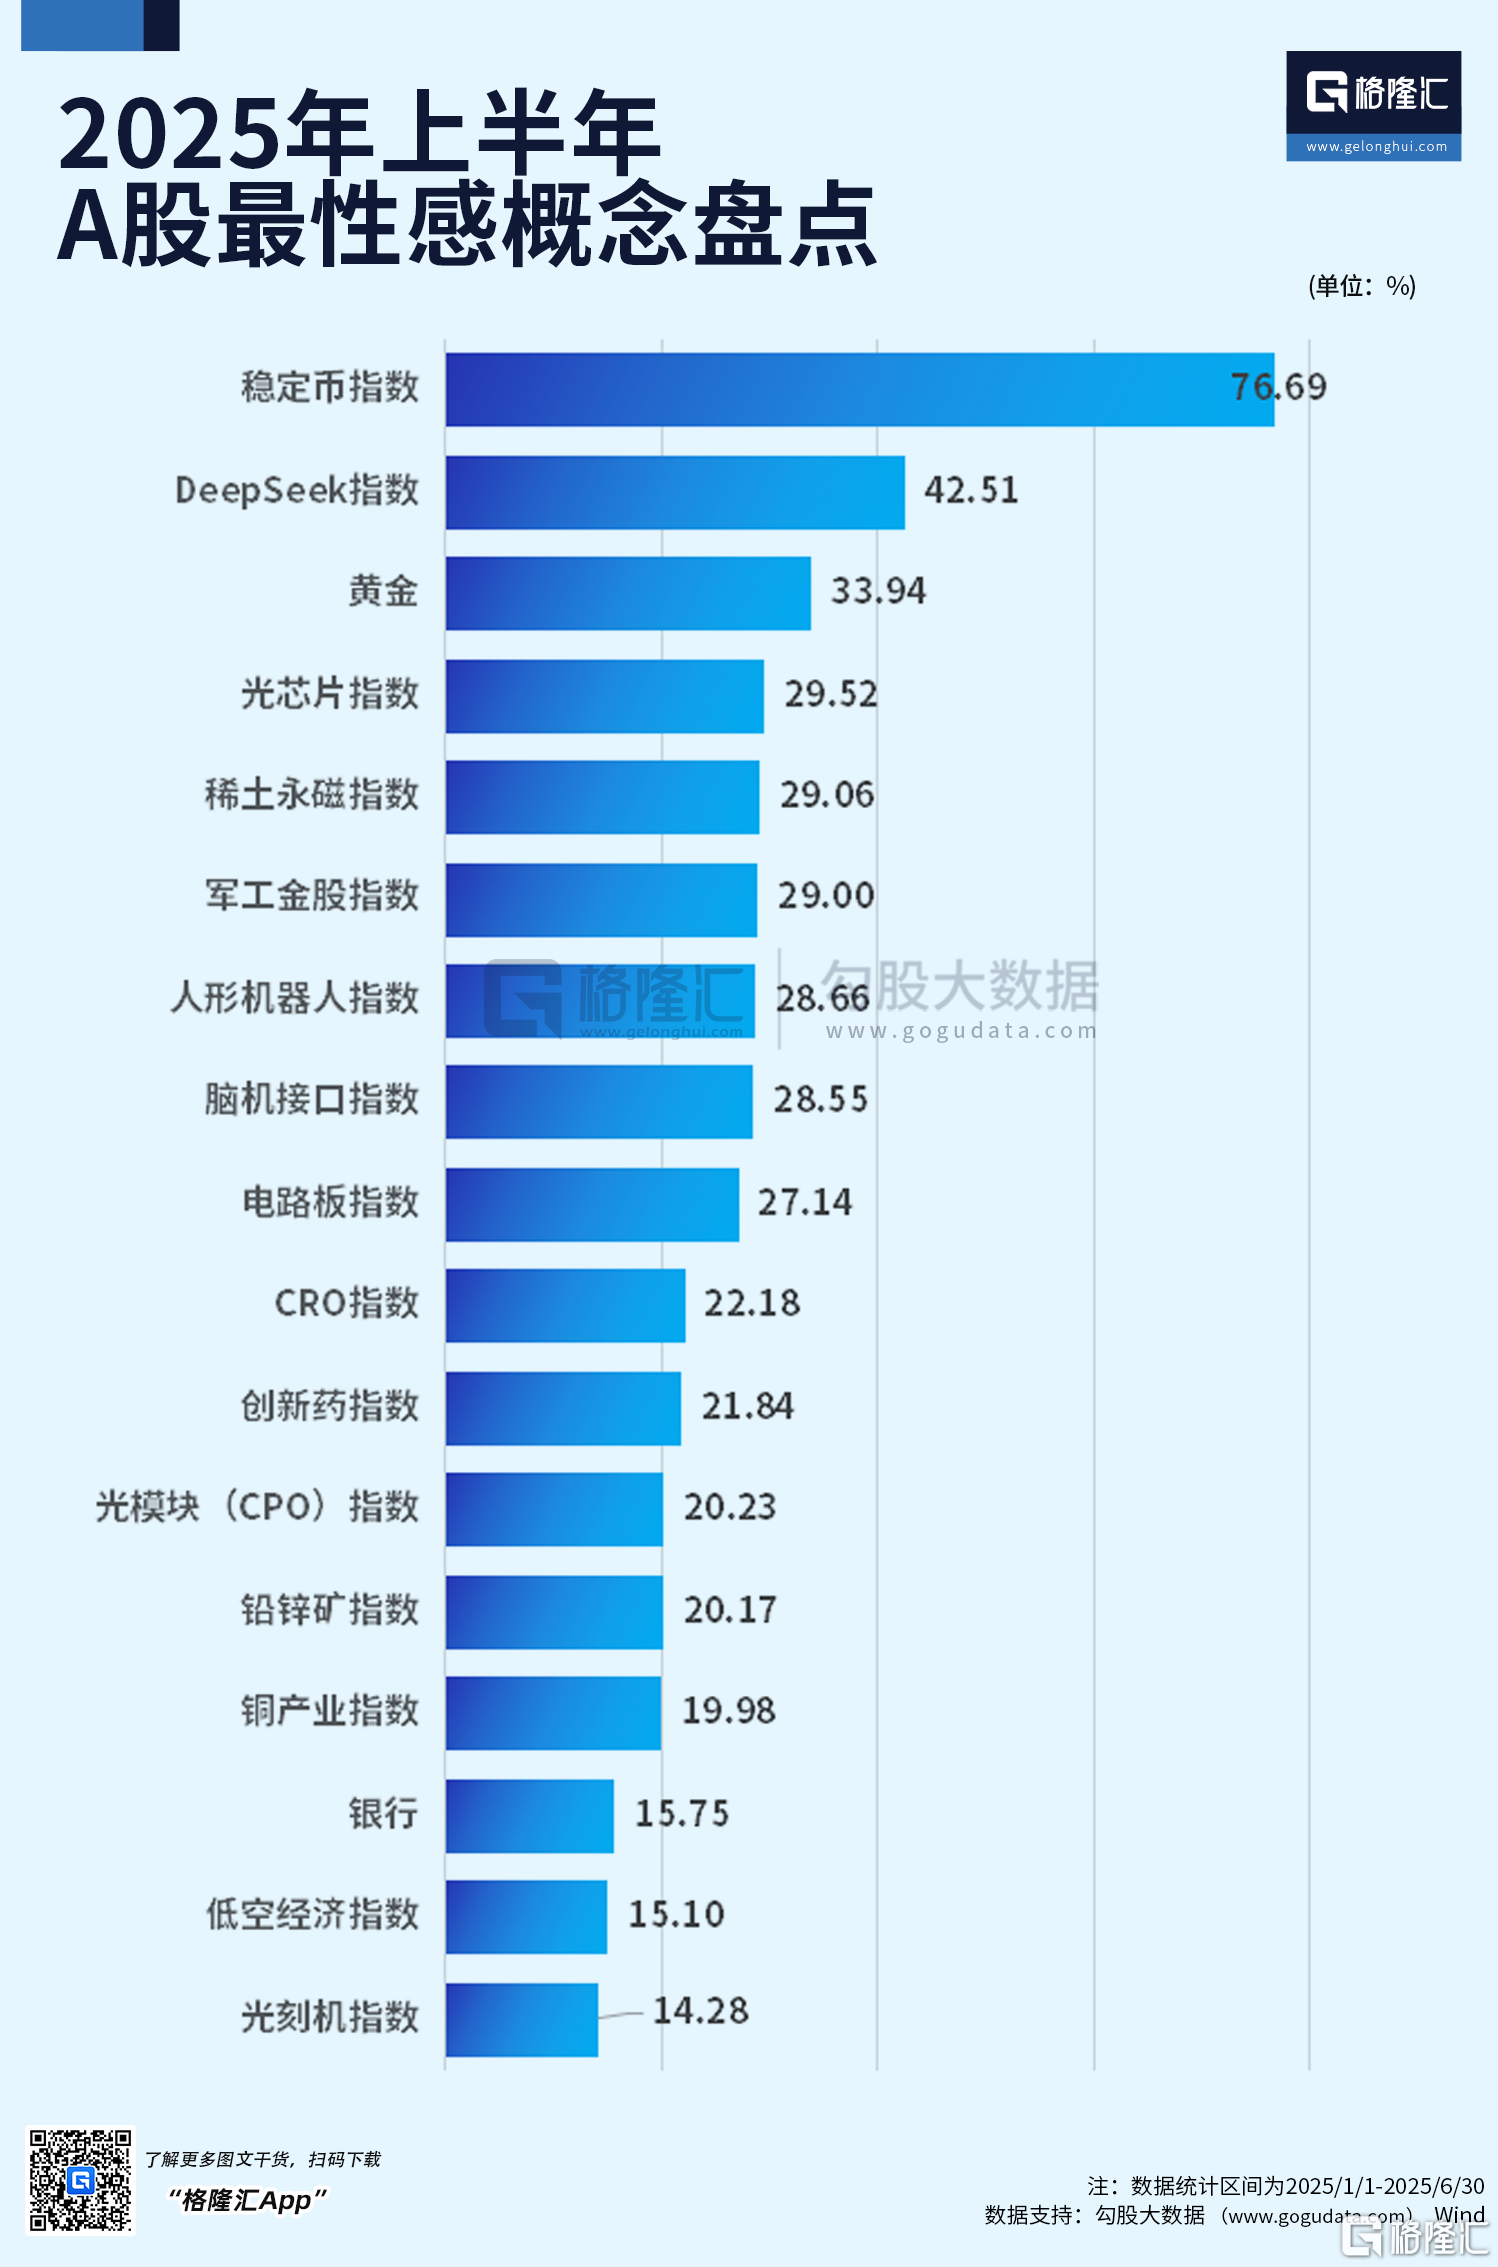
從市場概念指數表現來看,上半年穩定幣概念以76%的升幅傲視全場,DeepSeek概念以42%的升幅位居第二,在黃金不斷創新高的大背景下,黃金概念股以34%的升幅位居第三。此外,稀土、軍工、人形機器人、腦機接口、CRO、創新藥概念也在上半年掀起上升熱潮,成為投資者無法忽視的熱點。
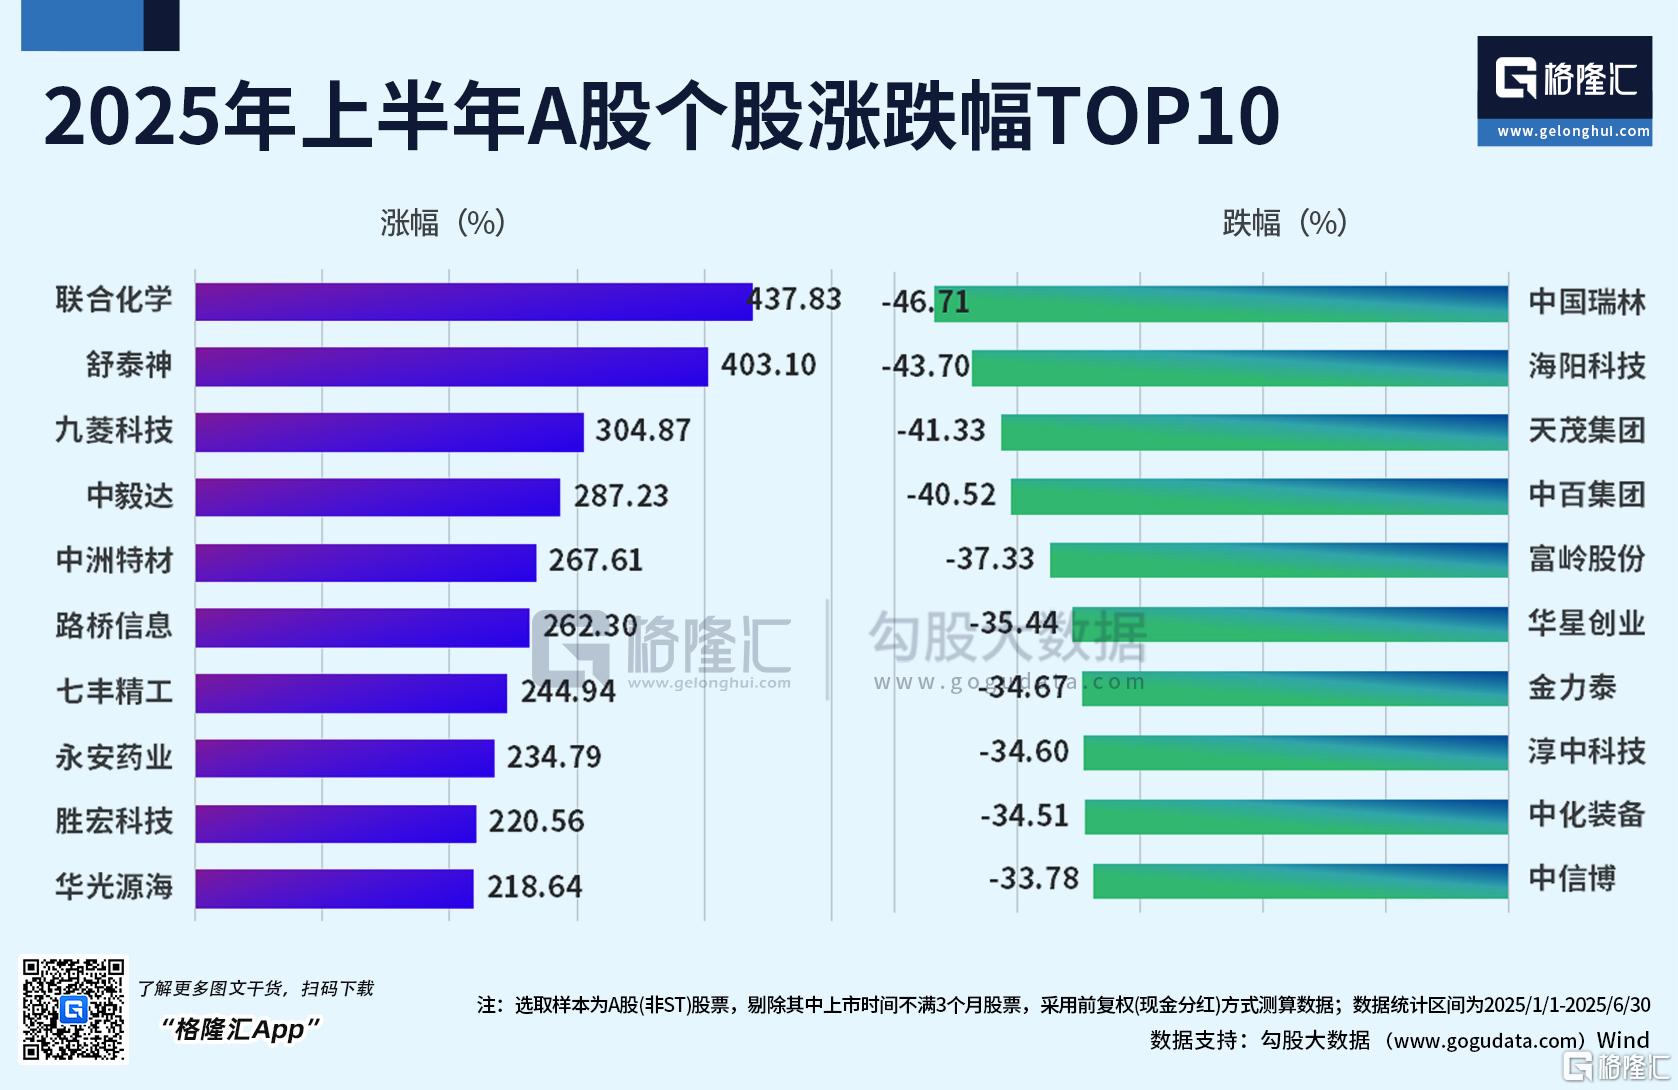
個股方面,2025年上半年A股升幅前十的個股,全部升超200%,升幅居前三個股分別是聯合化學(升幅437.83%)、舒泰神(升幅403.1%)、九菱科技(升幅449.66%);跌幅居前三的個股分別是中國瑞林(跌幅-46.71%),海陽科技(跌幅-43.7%)、天茂集團(跌幅-41.33%)。(注:剔除退市及ST 股、上市時間不滿3個月個股)
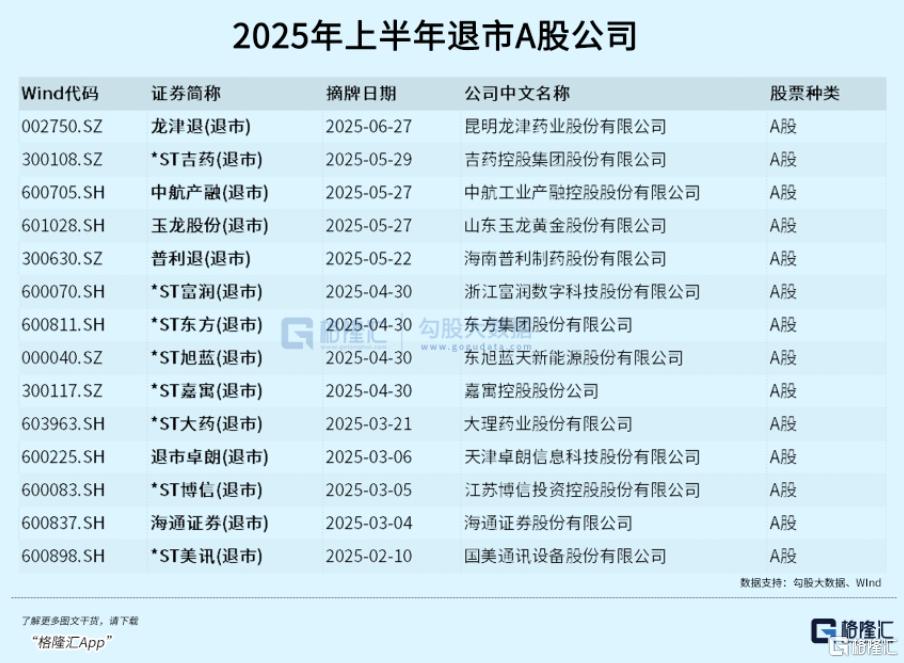
2025年上半年A股退市公司數量為14家,財務類退市佔主導地位。
這些退市公司包括了*ST美訊、*ST博信、*ST卓朗、*ST大藥、*ST旭藍、*ST東方、*ST嘉寓、*ST富潤等。
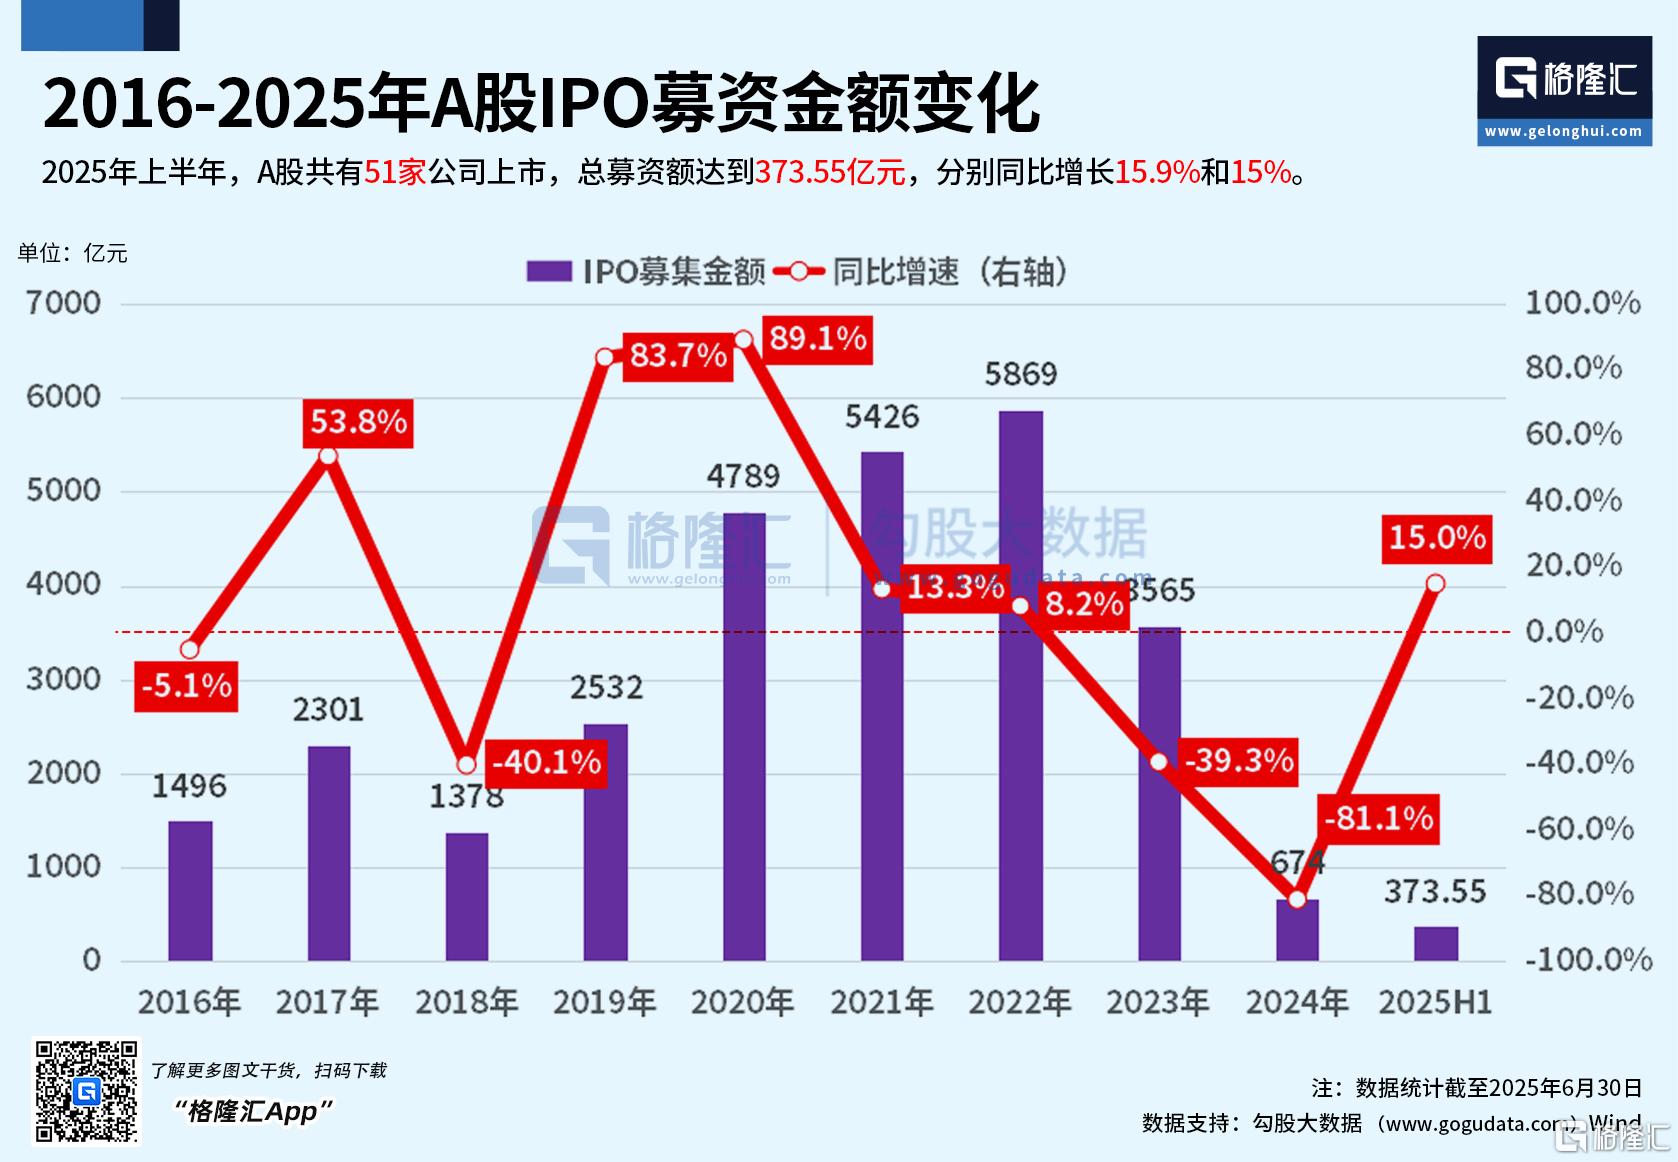
2025年上半年,A股共有51家公司上市,總募資額達到373.55億元,分別同比增長15.9%和15%
2025上半年港股畫像
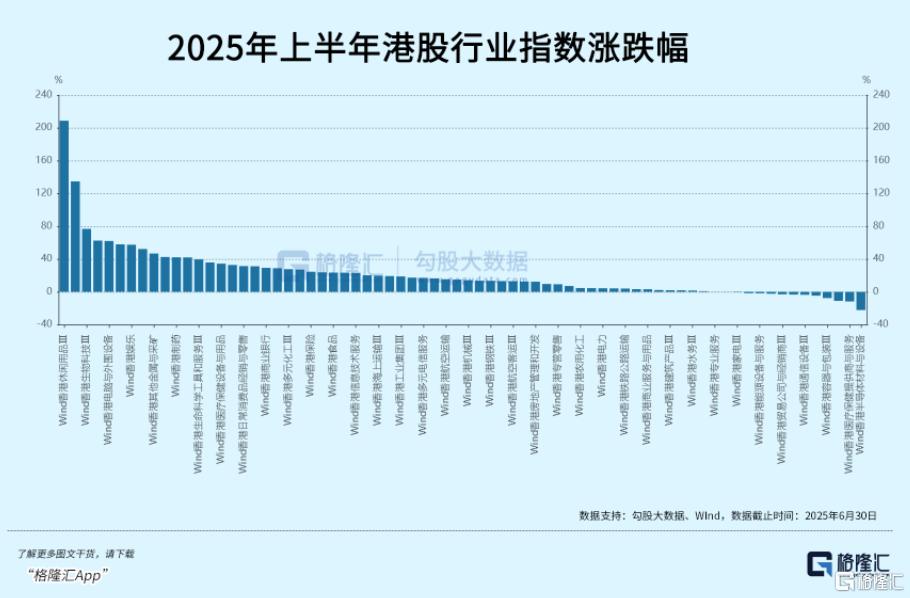
板塊表現方面,在上半年,多個行業指數升幅顯著,尤其是休閒用品、酒店餐飲、生物科技、貴金屬、電腦與外圍設備等領域。與此同時,部分傳統行業如能源、公用事業等表現相對較弱。
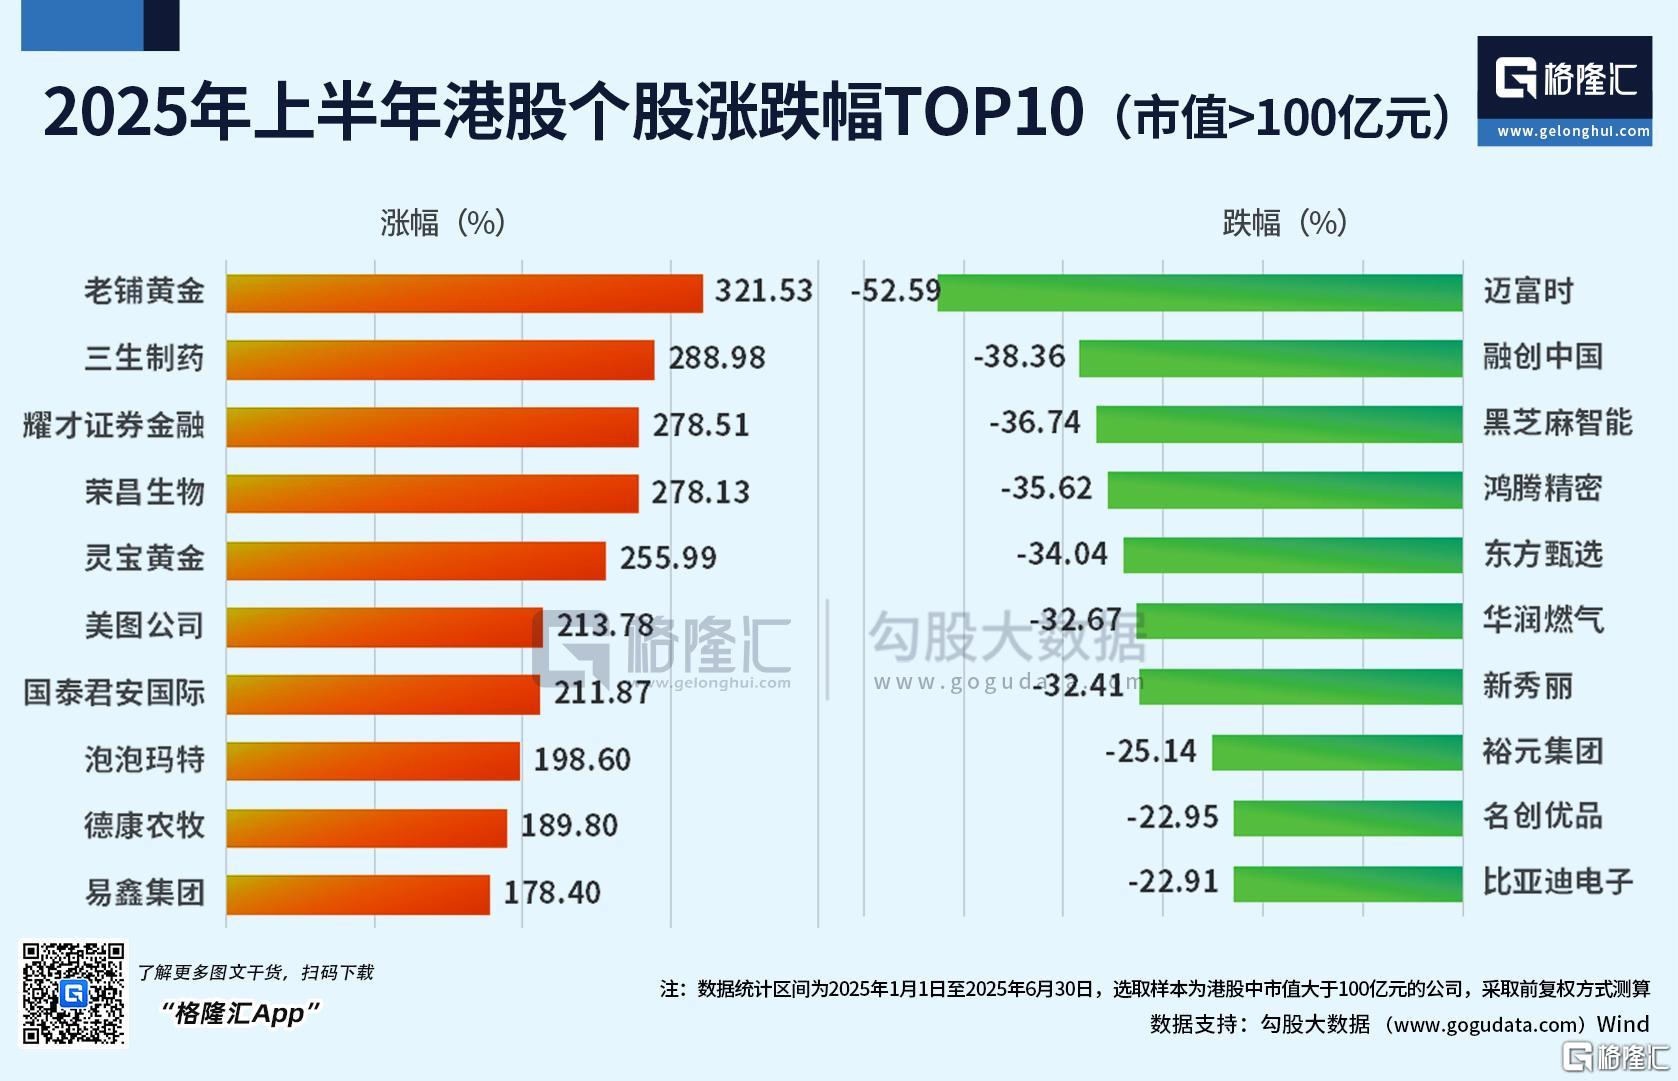
個股方面,剔除百億市值以下的,上半年升幅居前三個股分別是,老鋪黃金(上半年升幅321.53%)、三生製藥(上半年升幅288.98%)、耀才證券金融(上半年升幅278.51%);跌幅居前三的個股分別是,邁富時(上半年跌幅-52.59%)、融創中國(上半年跌幅-38.36%)、黑芝麻智能(上半年跌幅-36.74%)。
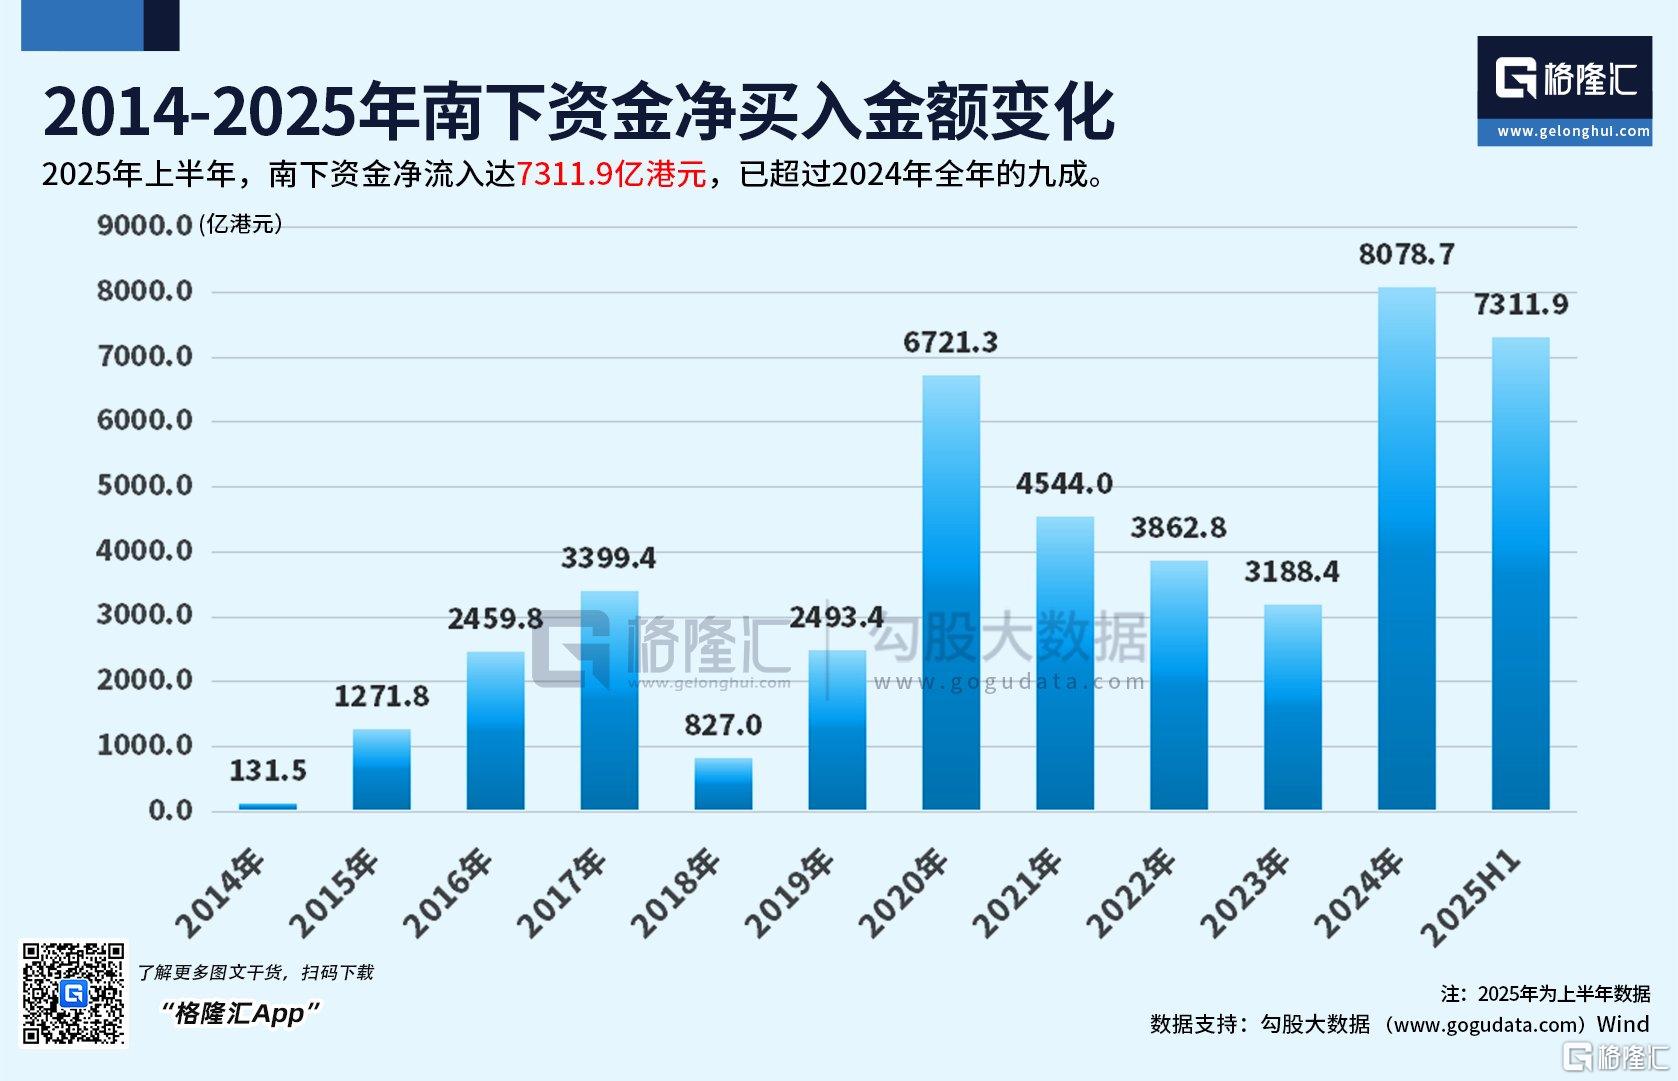
資金方面,南下資金2025年6月份累計淨買入港股802.51億港元,為連續第24個月淨買入。2025年上半年南下資金累計淨買入港股7311.87億港元,逼近2024年全年水平(8078.66億港元),更是2023年(3188.41億港元)的逾兩倍多。
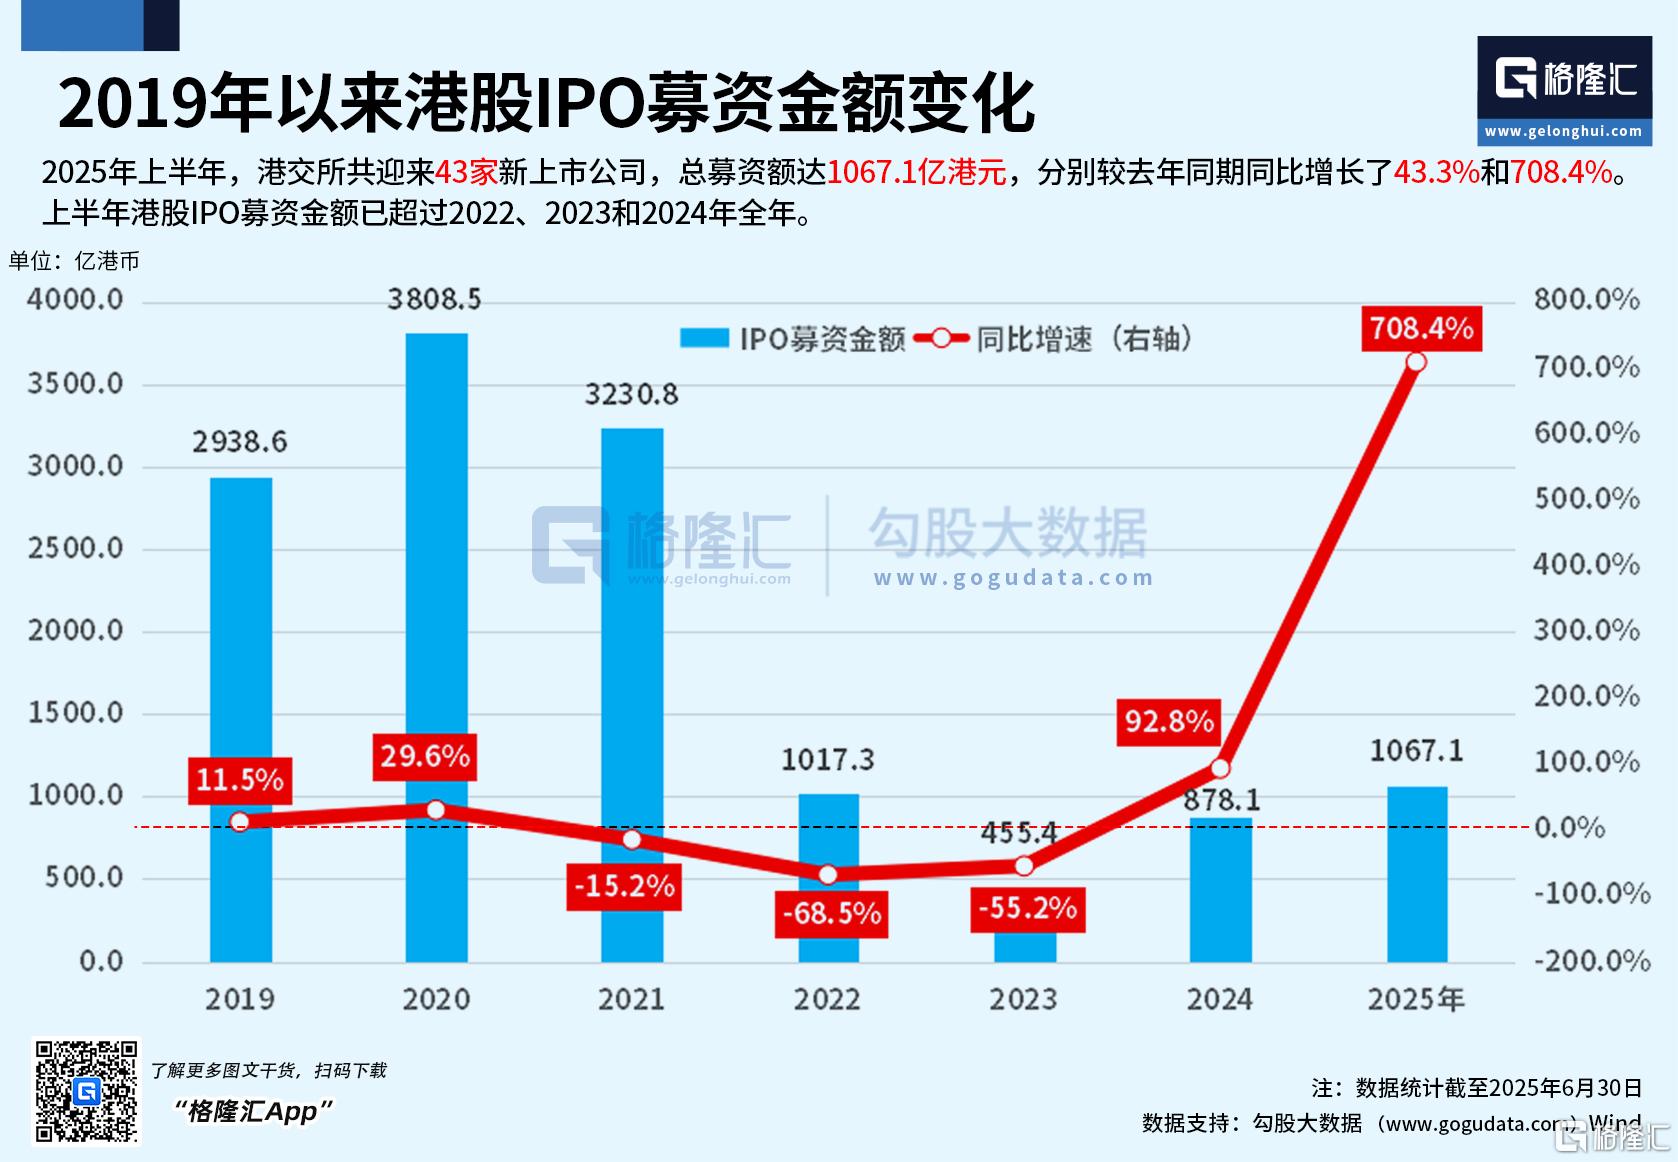
2025年上半年,港交所共迎來43家新上市公司,總募資額達1067.1億港元,分別較去年同期同比增長43.3%和708.4%。上半年港股IPO募資金額已超過2022、2023和2024年全年,創下融資額新高。若按交易所排名,港交所IPO募資規模位居全球榜首。
Follow us
Find us on
Facebook,
Twitter ,
Instagram, and
YouTube or frequent updates on all things investing.Have a financial topic you would like to discuss? Head over to the
uSMART Community to share your thoughts and insights about the market! Click the picture below to download and explore uSMART app!

Disclaimers
uSmart Securities Limited (“uSmart”) is based on its internal research and public third party information in preparation of this article. Although uSmart uses its best endeavours to ensure the content of this article is accurate, uSmart does not guarantee the accuracy, timeliness or completeness of the information of this article and is not responsible for any views/opinions/comments in this article. Opinions, forecasts and estimations reflect uSmart’s assessment as of the date of this article and are subject to change. uSmart has no obligation to notify you or anyone of any such changes. You must make independent analysis and judgment on any matters involved in this article. uSmart and any directors, officers, employees or agents of uSmart will not be liable for any loss or damage suffered by any person in reliance on any representation or omission in the content of this article. The content of the article is for reference only and does not constitute any offer, solicitation, recommendation, opinion or guarantee of any securities, virtual assets, financial products or instruments. Regulatory authorities may restrict the trading of virtual asset-related ETFs to only investors who meet specified requirements. Any calculations or images in the article are for illustrative purposes only.
Investment involves risks and the value and income from securities may rise or fall. Past performance is not indicative of future performance. Please carefully consider your personal risk tolerance, and consult independent professional advice if necessary.


