連虧7年卻被買爆,市值2700億!寒武紀憑啥?
寒武紀,徹底升瘋了……
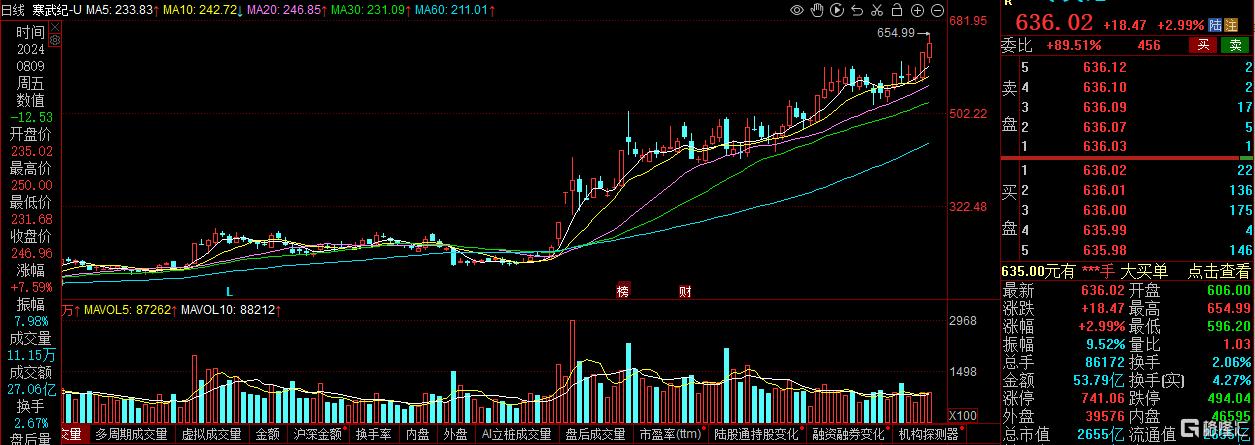
今天(12月19日),寒武紀盤中再升超5%,股價一度站上650元再創歷史新高,總市值超2700億元。截止收盤升2.99%,報636.02元。
從2023年初至今,寒武紀股價升幅達10倍,較2024年2月的低點(95.85元)升幅達500%。
對於資金的瘋狂炒作,分析認為,除了受美股芯片股的刺激之外,最近各大指數調倉也在一定程度上助力了寒武紀的爆發。
11月29日,中證指數公司公佈了上證50指數樣本的定期調整方案,此次寒武紀被調入上證50指數,新的指數樣本於2024年12月13日收市後生效。此外,中證A500指數也迎來首次調倉,更換21只樣本,於2024年12月13日收市後正式生效。納入成分股包括寒武紀-U、百濟神州-U等4只千億市值龍頭股。
雖然股價創了新高,但寒武紀的業績與之嚴重背離。寒武紀從2020年上市到2023年已連續多年虧損。
一邊是不斷新高的股價,一邊是連年虧損的業績,使得“AI芯片第一股”寒武紀飽受爭議。
7年累計虧損近50億
業績方面,從近三年的年報數據來看,2022年營收7.29億,2023年營收7.09億,呈現略微下滑趨勢,2024年前三季度營收1.85億元。
淨利潤方面,2020年至2023年期間,寒武紀的歸母淨利潤一直處於虧損狀態,且虧損額較大。
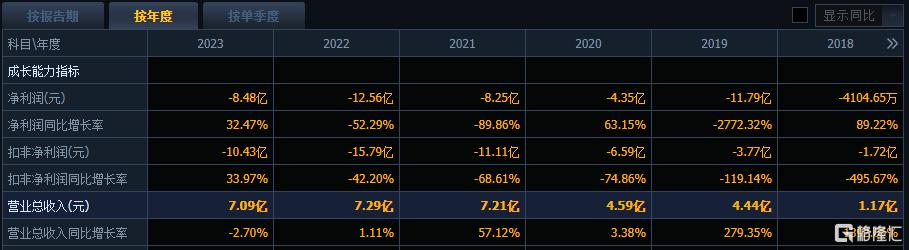
拉長時間線看,寒武紀自2017年公開財務數據至今,一直身陷虧損中。2017年-2023年寒武紀虧損數額分別為3.807億元、0.41億元、11.79億元、4.35億元、8.25億元、11.66億元、8.48億,7年累計虧損近50億。截至2024年第三季度末,寒武紀,歸母淨利潤虧損7.24億元。
多位創投股東清倉式減持
值得注意的是,2023年下半年,隨着股價回暖,寒武紀多位創投股東進行清倉式減持。
2023年9月22日,寒武紀發佈公吿稱,股東國投創業基金減持實施完畢,本次累計減持739.87萬股,套現14.81億元,減持後,國投創業基金持有寒武紀股份數量僅剩1176股,基本完成清倉。
寧波瀚高也於去年3月完成清倉寒武紀,套現2.25億元。
古生代創業則於2022年11月15日至2023年3月14日,累計減持428.87萬股,套現3.61億元。隨後,古生代創業再於3月23日-8月24日大幅減持寒武紀,套現10.71億元。
此外,南京招銀、湖北招銀也在2023年清倉寒武紀。公吿顯示,2023年2月9日-6月7日,南京招銀和湖北招銀分別減持311.46萬股、153.95萬股,分別套現了3.88億元、1.91億元。
上述5名創投股東,基本上完成對寒武紀的清倉,累計減持套現41.83億元。
Follow us
Find us on
Facebook,
Twitter ,
Instagram, and
YouTube or frequent updates on all things investing.Have a financial topic you would like to discuss? Head over to the
uSMART Community to share your thoughts and insights about the market! Click the picture below to download and explore uSMART app!

Disclaimers
uSmart Securities Limited (“uSmart”) is based on its internal research and public third party information in preparation of this article. Although uSmart uses its best endeavours to ensure the content of this article is accurate, uSmart does not guarantee the accuracy, timeliness or completeness of the information of this article and is not responsible for any views/opinions/comments in this article. Opinions, forecasts and estimations reflect uSmart’s assessment as of the date of this article and are subject to change. uSmart has no obligation to notify you or anyone of any such changes. You must make independent analysis and judgment on any matters involved in this article. uSmart and any directors, officers, employees or agents of uSmart will not be liable for any loss or damage suffered by any person in reliance on any representation or omission in the content of this article. The content of the article is for reference only and does not constitute any offer, solicitation, recommendation, opinion or guarantee of any securities, virtual assets, financial products or instruments. Regulatory authorities may restrict the trading of virtual asset-related ETFs to only investors who meet specified requirements. Any calculations or images in the article are for illustrative purposes only.
Investment involves risks and the value and income from securities may rise or fall. Past performance is not indicative of future performance. Please carefully consider your personal risk tolerance, and consult independent professional advice if necessary.


