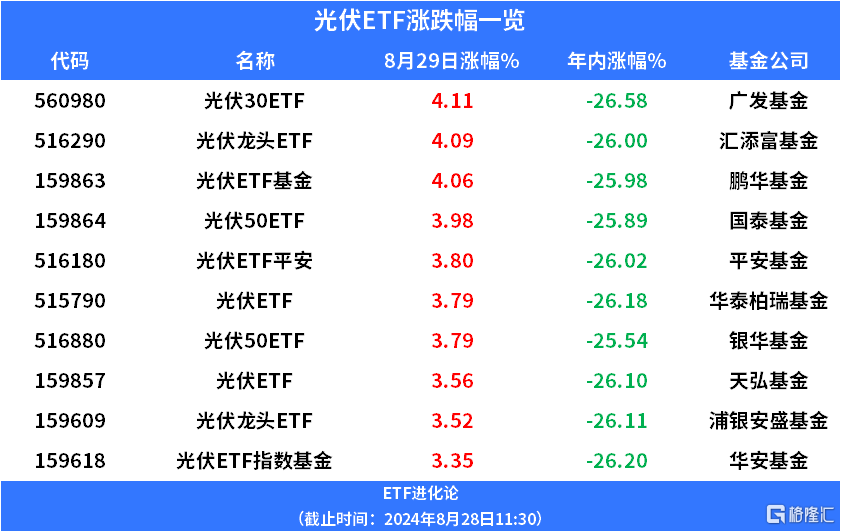
光伏ETF基金、光伏30ETF、光伏龍頭ETF升超4%,光伏板塊強勢上升
光伏板塊拉昇,錦浪科技、禾邁股份、陽光電源、固德威、愛旭股份大升,光伏ETF領升市場。廣發基金光伏30ETF、匯添富基金光伏龍頭ETF、鵬華基金光伏ETF基金升超4%,國泰基金光伏50ETF、光伏ETF平安、華泰柏瑞基金光伏ETF、銀華基金光伏50ETF、天弘基金光伏ETF、浦銀安盛基金光伏龍頭ETF、華安基金光伏ETF指數基金升超3.5%。
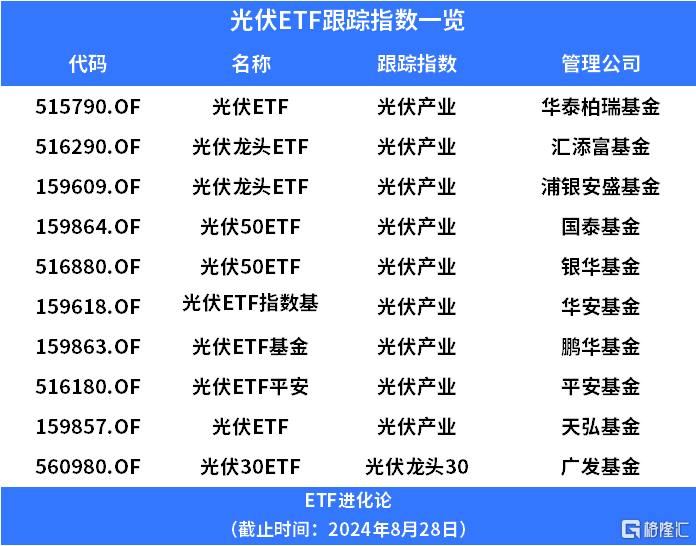
目前市場上有10只光伏ETF,規模最大的是華泰柏瑞光伏ETF,最新規模74.54億。從光伏ETF跟蹤的指數看,廣發基金光伏30ETF跟蹤光伏龍頭30指數,其餘9只ETF跟蹤光伏產業指數。
光伏板塊上升,消息面上,國家能源局新能源和可再生能源司司長李創軍表示,截至今年7月底,中國風電裝機達到4.71億千瓦,太陽能發電達到了7.35億千瓦,風光裝機合計達到了12.06億千瓦。中國風電、太陽能發電高質量躍升發展,為應對氣候變化、保障能源供應、推動清潔低碳轉型、促進全球新能源發展都作出了重要貢獻,中國已經成為全球應對氣候變化、減少碳排放的重要引領者和推動者,同時中國要實現碳達峯,2030年非化石能源消費佔比達到25%左右,還需要繼續推動風電光伏大規模高質量發展。
此外,近日隆基綠能、TCL中環兩大光伏巨頭相繼宣佈上調旗下多款單晶硅片報價。據瞭解,隆基綠能本輪調價後,N-G10L報價為1.15元/片、N-G12R報價為1.3元/片,新報價平均上調5分/片。TCL中環調價後與隆基綠能產品價格一致,硅片產品N型G10報價為1.15元/片、N型G12R報價為1.3元/片,N型G12報價為1.5元/片。
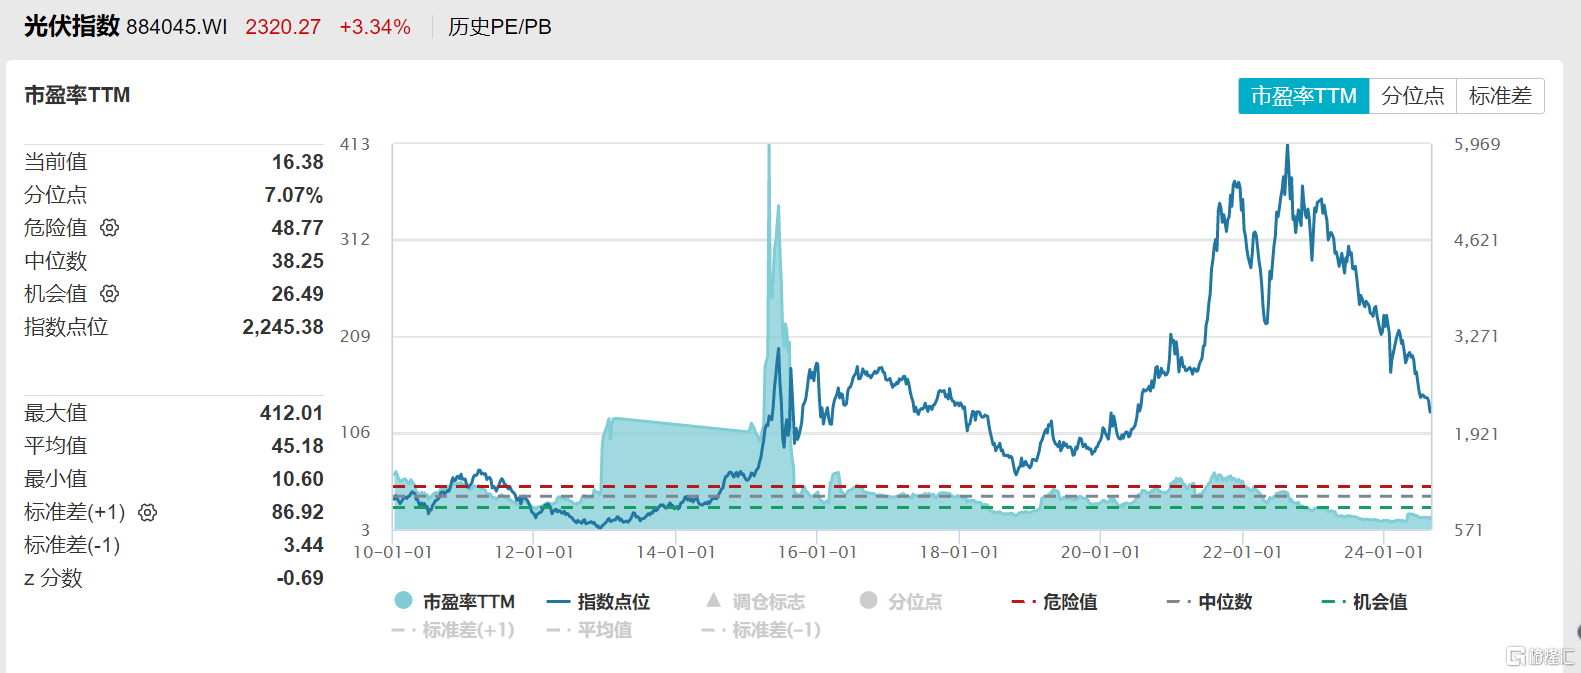
從估值看,光伏板塊的市盈率估值自2021年底以來持續下降,目前已經接近甚至低於2018年底板塊估值水平,光伏指數最新市盈率16.38倍,處於上市以來7.07%分位。
從行業基本面看,2024年7月國內新增光伏裝機延續增長。據國家能源局,2024年1-7月,國內新增光伏裝機123.53GW,同比增長31%;其中7月新增光伏裝機21.05GW,同比+12%,環比-10%。隨着消納紅線放寬至90%,集中式項目併網進度有望加快。由於電價波動以及政策調整預期,户用端需求相對疲軟,增速有所放緩;工商業項目表現較好,支撐分佈式裝機。
華創證券表示,展望2024全年,產業鏈價格低位運行,終端裝機成本改善,項目收益率提升刺激下游裝機需求,下半年國內地面電站傳統季節性裝機旺季來臨,國內新增光伏裝機有望實現較高增長。
國盛證券認為,光伏行業週期+成長邏輯並沒有改變,其邏輯基於:
當前,市場擔憂主動去庫時間過長,光伏行業成為純週期行業。2024年裝機需求可能進入“緩步增長”階段。主動補庫週期中極端的產能擴張,導致產業鏈價格快速下行。成長性依然是此輪光伏下行週期中重要的託底因素。目前需求端遇到的諸多問題均是光伏發電成長到主力能源中必然遇到的瓶頸和陣痛。只是這次陣痛足夠激烈,可能引發大規模出清,但同時也是光伏行業促生破壞式創新、改善行業格局、構築技術壁壘的極佳機會。因此,光伏研究需要從供給端追蹤高頻數據,轉變至跟蹤需求數據、推導需求景氣度的後續走勢。我們認為,需求端的成長性依然是影響行業的重要特徵,是行業下行中重要的託底因素。
國際市場光伏需求展望,瞄準高溢價市場,光伏產能出海中東。中歐市場起量不增利,高溢價市場仍是利潤突破口。2023年下半年光伏主產業鏈企業受價格下行影響,均進入虧損區間。高溢價市場仍可保障一體化組件廠及產業鏈出海產能實現較強盈利。此外,東南亞繞道出口美國帶來超額盈利,但綠色通道即將結束,因此產能出海中東成為出口美國新通道。
Follow us
Find us on
Facebook,
Twitter ,
Instagram, and
YouTube or frequent updates on all things investing.Have a financial topic you would like to discuss? Head over to the
uSMART Community to share your thoughts and insights about the market! Click the picture below to download and explore uSMART app!

Disclaimers
uSmart Securities Limited (“uSmart”) is based on its internal research and public third party information in preparation of this article. Although uSmart uses its best endeavours to ensure the content of this article is accurate, uSmart does not guarantee the accuracy, timeliness or completeness of the information of this article and is not responsible for any views/opinions/comments in this article. Opinions, forecasts and estimations reflect uSmart’s assessment as of the date of this article and are subject to change. uSmart has no obligation to notify you or anyone of any such changes. You must make independent analysis and judgment on any matters involved in this article. uSmart and any directors, officers, employees or agents of uSmart will not be liable for any loss or damage suffered by any person in reliance on any representation or omission in the content of this article. The content of the article is for reference only and does not constitute any offer, solicitation, recommendation, opinion or guarantee of any securities, virtual assets, financial products or instruments. Regulatory authorities may restrict the trading of virtual asset-related ETFs to only investors who meet specified requirements. Any calculations or images in the article are for illustrative purposes only.
Investment involves risks and the value and income from securities may rise or fall. Past performance is not indicative of future performance. Please carefully consider your personal risk tolerance, and consult independent professional advice if necessary.


