全球股市史詩級大崩盤!日經熔斷,美股暴跌,多隻跨境ETF跌停
美國經濟陷衰退隱憂,全球股市進入恐慌性暴跌模式。
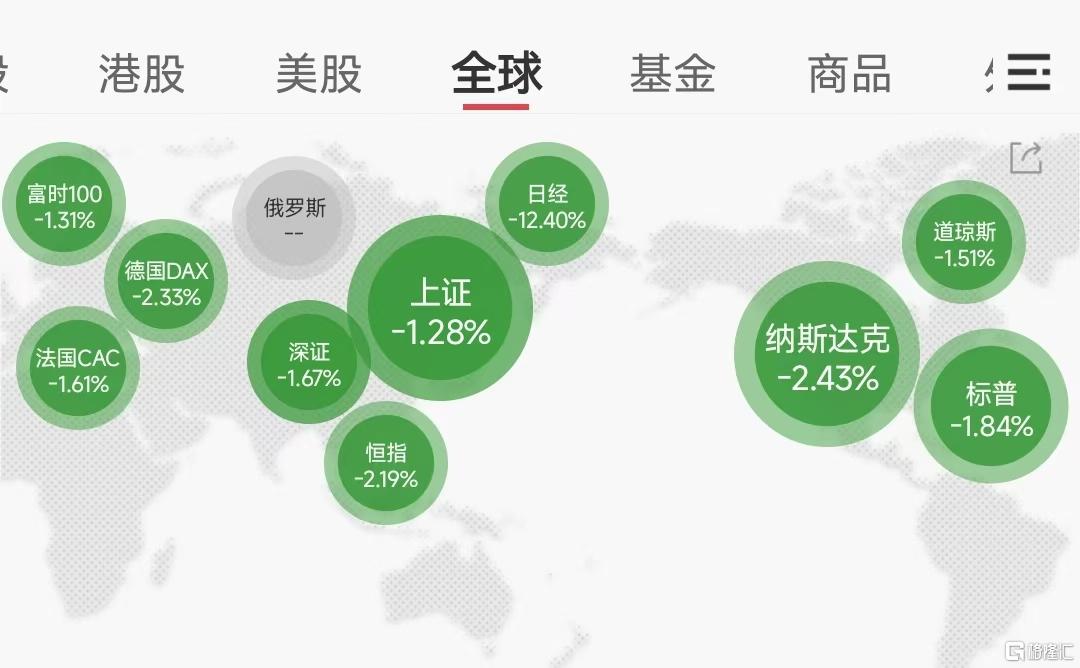
日經指數、韓國綜指熔斷,日股、美股、歐洲和新興市場股市不約而同遭遇了明顯打擊。
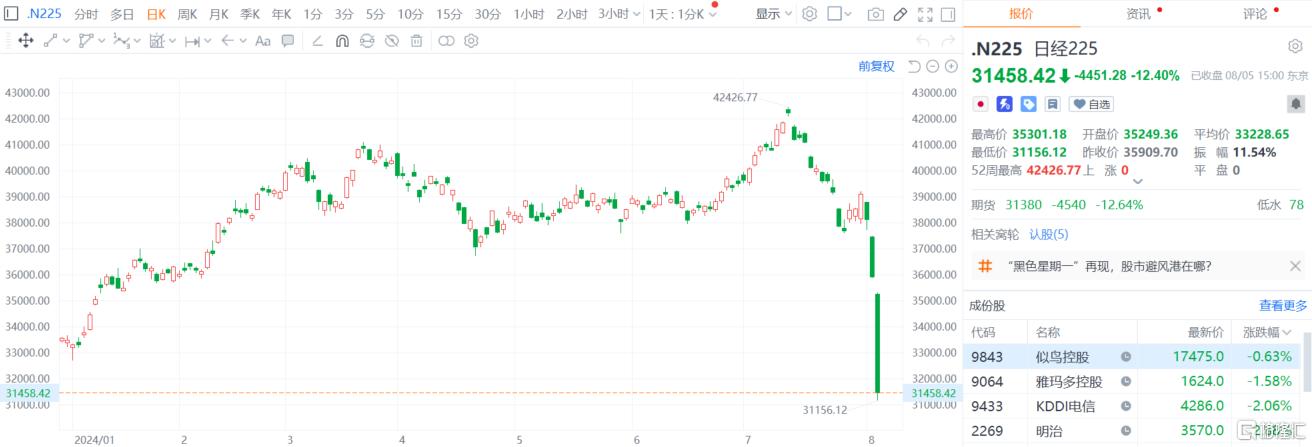
日本日經指數在8月1日和2日連續下跌,創下四年多來的最大單日跌幅。
今日(8月5日),日本股市繼續重挫,日經225指數收盤下跌4451.28點,跌幅12.4%,報31458.42點,已抹去今年以來所有升幅,日經指數創下史上最大下跌點數,超越1987年10月黑色星期一的紀錄。
東證指數更是觸發熔斷,創下八年來單日最大跌幅紀錄,跌12.23%。日元進一步走強,日元兑美元升破143關口至142.185,創1月初以來新高。
台股崩1800點,收跌8.4%,創下1967年以來的最大跌幅。人工智能芯片製造商台灣半導體制造股份有限公司領跌,下跌9.8%,也創下單日跌幅紀錄。
其韓國競爭對手股價也大幅下挫,韓國創業板指暴跌8%後停止交易。澳大利亞股市創下6月底來最低水平。

美股股指期貨延續跌勢,納指期貨跌幅擴大至3%,標準普爾500期貨下跌1.6%。
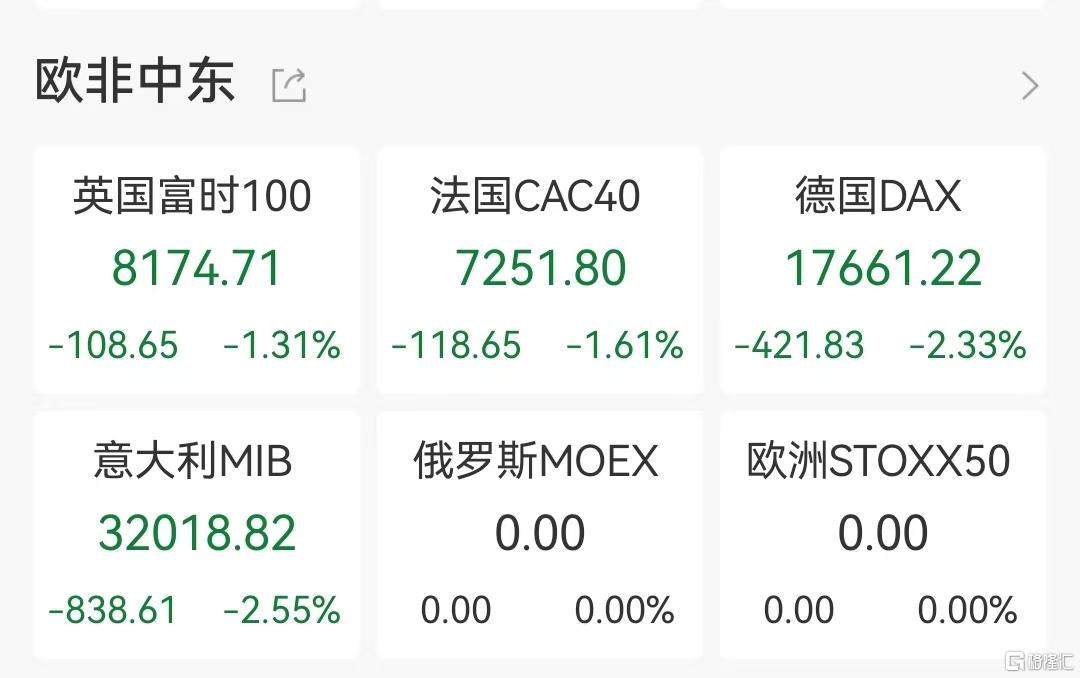
歐洲股市也出現普遍下跌,德國DAX指數期貨跌2.3%,法國CAC40指數跌1.61%,英國富時100指數期貨跌1.31%。
MSCI亞太指數暴跌5%,預計將抹去2024年的升幅。
受外圍股市大跌拖累,午後多隻跨境ETF大幅跳水,納指科技ETF、日經225ETF跌停,日經ETF、日經225ETF易方達跌超9%,日本東證指數ETF、納指ETF跌超8%,納斯達克ETF跌超7%。

對於市場表現,有分析指出根本原因還是因為全球股市位於歷史高位,也就是股市泡沫加上美國經濟衰退預期。市場預計美聯儲9月降息50個基點。直接原因是中東局勢升級,伊朗揚言報復以色列暗殺哈馬斯政治局領袖哈尼亞。美國已增員航母和海軍陸戰隊。
高盛分析師在一份報吿中表示:“我們將12個月內經濟衰退的可能性提高了10個百分點,達到25%”,但高盛認為經濟衰退的風險還是有限。
摩根大通的分析師甚至更加悲觀,認為美國經濟衰退的可能性為 50%。
市場價格走勢也凸顯出,市場情緒已迅速從關注人工智能的潛力轉向關注美國經濟衰退的風險以及英特爾等公司令人失望的盈利前景。
台灣、韓國和日本是週一亞洲股市表現最差的地區,這反映了這些公司的出口導向型和對全球最大經濟體的依賴。
盛寶銀行股票策略主管 Peter Garnry 表示:“今年以來,台指和日本股市一直是表現最好的市場之一,這得益於日元的廉價融資和人工智能的強勁人氣。現在,由於這兩個因素都出現逆轉,很多交易員都在退出獲利。我認為這是典型的動量崩盤,這是一個經過充分研究的現象。”
Follow us
Find us on
Facebook,
Twitter ,
Instagram, and
YouTube or frequent updates on all things investing.Have a financial topic you would like to discuss? Head over to the
uSMART Community to share your thoughts and insights about the market! Click the picture below to download and explore uSMART app!

Disclaimers
uSmart Securities Limited (“uSmart”) is based on its internal research and public third party information in preparation of this article. Although uSmart uses its best endeavours to ensure the content of this article is accurate, uSmart does not guarantee the accuracy, timeliness or completeness of the information of this article and is not responsible for any views/opinions/comments in this article. Opinions, forecasts and estimations reflect uSmart’s assessment as of the date of this article and are subject to change. uSmart has no obligation to notify you or anyone of any such changes. You must make independent analysis and judgment on any matters involved in this article. uSmart and any directors, officers, employees or agents of uSmart will not be liable for any loss or damage suffered by any person in reliance on any representation or omission in the content of this article. The content of the article is for reference only and does not constitute any offer, solicitation, recommendation, opinion or guarantee of any securities, virtual assets, financial products or instruments. Regulatory authorities may restrict the trading of virtual asset-related ETFs to only investors who meet specified requirements. Any calculations or images in the article are for illustrative purposes only.
Investment involves risks and the value and income from securities may rise or fall. Past performance is not indicative of future performance. Please carefully consider your personal risk tolerance, and consult independent professional advice if necessary.


