You are browsing the Hong Kong website, Regulated by Hong Kong SFC (CE number: BJA907). Investment is risky and you must be cautious when entering the market.
但斌、梁宏領跑!私募上半年業績出爐
格隆匯 07-08 14:37

2024年上半年已收官,私募上半年業績也在日前出爐。私募整體業績呈虧損狀態,百億私募表現較好。證券私募產品(含五大策略)整體平均虧損1.88%,其中,主觀股票策略平均虧損5.45%;百億私募年內平均收益為正。


主觀股票策略業績欠佳


私募排排網數據顯示,截至6月30日,有業績記錄的5156傢俬募旗下五大策略私募證券產品上半年平均虧損1.88%,其中,2157家實現正收益,佔比為41.8%。

實際上,五大策略私募產品中,債券、多資產、期貨及衍生品、組合等四大策略都取得了正收益,唯有主觀股票策略表現欠佳。

債券策略上半年表現最好,納入統計的434傢俬募旗下債券策略平均收益率為4.79%,其中,343家實現正收益,佔比為79%。多資產策略、期貨及衍生品策略、組合基金的上半年平均收益率分別為3.82%、3.03%、2.03%。

今年上半年,A股市場持續震盪,除上證50、滬深300、中證A50指數外,其他主要指數均有不同程度下跌。滬指微跌0.25%,但創業板指、科創50指數跌幅超過10%,萬德微盤股指數跌超25%,北證50跌超30%。行業指數中,銀行、煤炭、公用事業、家電等少數板塊上升,超七成行業指數下跌。

受此影響,主觀股票私募產品在上半年整體出現虧損,有業績展示的3000傢俬募旗下股票策略平均虧損5.45%,其中有897家實現正收益,佔比為29.9%。


四成百億私募獲正收益


相較於私募整體虧損的表現,百億私募在年中考則交出了不錯的成績單。私募排排網數據顯示,截至6月30日,有業績記錄的79家百億私募上半年收益率均值為0.40%,其中,32家實現正收益,佔比為40.51%。

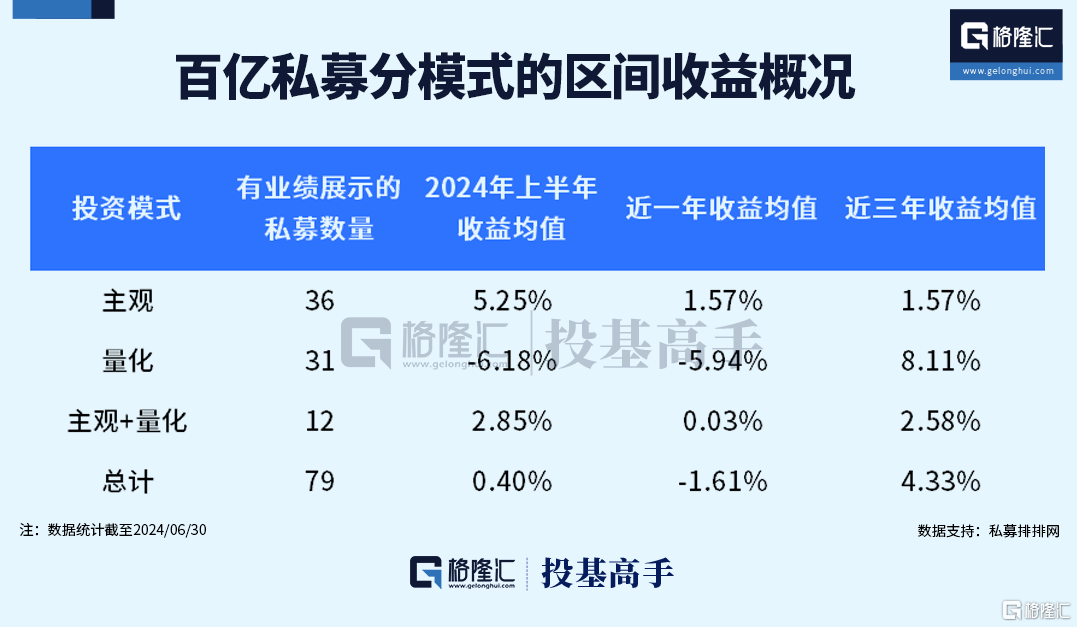
在百億私募中,量化私募收益較為慘淡,是上半年唯一平均收益為負的百億私募類型。上半年,有業績記錄的31家百億量化私募收益率均值跌至-6.18%,僅有3家實現正收益,佔比僅為9.68%。

“主觀+量化”私募表現尚可。上半年,有業績記錄的12家“主觀+量化”私募的收益率均值為2.85%,其中7家實現正收益,佔比近六成。

主觀股票策略的百億私募則表現亮眼。截至6月30日,有業績記錄的36家百億主觀股票私募上半年收益率均值為5.25%,其中,22家實現正收益,佔比達61.11%。


但斌VS梁宏:AI與紅利之爭


在百億私募的上半年業績比拼中,但斌掌舵的東方港灣憑藉47.92%的收益率斬獲冠軍,梁宏領銜的海南希瓦則憑29.48%的收益率拿下亞軍。上半年收益前十強中,樂瑞資產、睿璞投資、上海瓴仁私募、景林資產、喆顥資產、磐松資產的收益率也都超過了10%。

東方港灣在6月業績飆升,公司業績超越2021年高點,創下歷史新高。此外,東方港灣近一年收益接近56%,持續領跑頭部私募。自2014年10月有業績展示以來,截至2024年6月底,東方港灣年化收益已超22.5%。

東方港灣的成績得益於抓住了上半年美股的AI行情。但斌自去年開始多次表示重倉了英偉達,並始終看好AI投資。7月5日,東方港灣發文點評了蘋果WWDC大會和即將發佈的IOS18操作系統的“雲端大模型+本地小模型”架構,稱未來AI推理的算力需求上限是“不可估量”的,目前任何的測算都顯得沒有意義。

上半年,納斯達克指數上升18.13%。英偉達作為全球AI算力龍頭,在繼去年大升240%後,今年上半年從49.52美元/股,升至123.54美元/股,升幅149.50%,並在6月份一度問鼎全球市值第一。

梁宏掌舵的海南希瓦也在6月份創下業績新高,近一年收益也高達37.17%,同樣奪得百億私募亞軍。自2015年4月有業績展示以來,海南希瓦年化收益已超過26%。

海南希瓦的好成績則是因為抓住了港股的紅利行情。6月初,梁宏曾在社交媒體表示,港股不少高息股還是便宜,股息率依然具有吸引力。此外,梁宏還多次提及喜愛油氣股。

上半年,恒生中國企業指數上升9.77%。港股油氣代表標的中國海洋石油累計上升81.52%,有人預測這是梁宏的重倉股。

Follow us
Find us on Facebook, Twitter , Instagram, and YouTube or frequent updates on all things investing.Have a financial topic you would like to discuss? Head over to the uSMART Community to share your thoughts and insights about the market! Click the picture below to download and explore uSMART app!
Disclaimers
uSmart Securities Limited (“uSmart”) is based on its internal research and public third party information in preparation of this article. Although uSmart uses its best endeavours to ensure the content of this article is accurate, uSmart does not guarantee the accuracy, timeliness or completeness of the information of this article and is not responsible for any views/opinions/comments in this article. Opinions, forecasts and estimations reflect uSmart’s assessment as of the date of this article and are subject to change. uSmart has no obligation to notify you or anyone of any such changes. You must make independent analysis and judgment on any matters involved in this article. uSmart and any directors, officers, employees or agents of uSmart will not be liable for any loss or damage suffered by any person in reliance on any representation or omission in the content of this article. The content of the article is for reference only and does not constitute any offer, solicitation, recommendation, opinion or guarantee of any securities, virtual assets, financial products or instruments. Regulatory authorities may restrict the trading of virtual asset-related ETFs to only investors who meet specified requirements. Any calculations or images in the article are for illustrative purposes only.
Investment involves risks and the value and income from securities may rise or fall. Past performance is not indicative of future performance. Please carefully consider your personal risk tolerance, and consult independent professional advice if necessary.
uSMART
Wealth Growth Made Easy
Open Account