格隆匯基金日報 | 多年一次的市場機遇!景林資產發聲
一、知名基金經理最新動態
鄭澄然所管基金進入天合光能前十大流通股東
6月25日數據顯示,天合光能最新公佈的前十大流通股東名單中,鄭澄然的廣發高端製造股票現身,持股3582.99萬股。
二、今日基金新聞速覽
景林資產:當下是多年一次的機遇
千億私募景林資產6月30日發佈了一份最新的半年度市場策略展望。景林資產稱,在經歷了兩年的槓桿調整之後,從今年開始,中國經濟的“流動性”會逐步改善。而5月17日發佈的房地產貸款首付比例和利率的調整,應該看作中國宏觀經濟重要的政策拐點。當下很多龍頭公司出現便宜的估值,這樣的市場機遇“很多年才會出現一次”。
基金經理下半年看好三大方向
近期公佈的一份“基金經理下半年投資調查”結果顯示,基金經理對下半年A股市場大多持中性偏樂觀態度,六成以上的基金經理將維持倉位或加倉。投資偏好上,大市值風格佔據明顯優勢,高股息、資源板塊及TMT三大方向最受基金經理青睞。
上半年港股主題基金髮行規模超60億元
今年上半年,港股市場投資機會明顯,機構加快佈局步伐。Wind數據顯示,上半年公募基金合計發行港股主題基金35只,發行規模超過60億元,其中有3只產品發行規模均超過10億元。
超五成公募基金上半年取得正回報
上半年已有半數以上基金產品取得了正回報。Wind數據顯示,在全市場12028只基金產品中,共有6733只產品上半年業績為正,佔比約為56%。在上半年業績排名前十的基金產品中,共有4只為QDII基金。部分偏股混合型和靈活配置型基金同樣有着不俗表現。例如,宏利基金旗下兩隻產品——宏利景氣領航兩年持有、宏利景氣智選18個月持有A今年以來的回報率已分別達到了30.19%、30.06%。
九成以上商品型基金獲正收益
Wind數據顯示,截至6月30日,35只商品型基金(同一基金不同份額合併計算)在今年上半年的平均收益達到11.8%,在所有基金二級投資類型中領先。具體來看,32只商品型基金今年上半年獲正收益,佔所有商品型基金九成以上。即便是年內虧損最多的商品型基金,上半年淨值回報為-2.62%,處於全市場基金前70%的水平。
純債基金近一年收益率超銀行理財
濟安金信基金評價中心數據顯示,從近一年業績來看,截至6月26日,純債類基金“戰勝”了銀行固收理財,前者以平均3.88%的收益率戰勝了後者3.02%的平均收益率。其中,業績超4%的純債類基金佔比為36.89%,而銀行理財同類產品的佔比為19.03%;業績在0%-3%的產品佔比,純債類基金有八成,銀行固收理財不到五成。同時,從虧損角度看,純債類基金虧損的產品佔0.45%的比重,銀行固收理財虧損產品的佔比為1.7%。
年內公募淨申購金額近39億元
公募排排網數據顯示,截至6月28日,年內共有127家公募對旗下產品自購和贖回,其中有114家公募機構自購2690次,103家公募機構贖回810次,合計淨申購金額38.82億元。從基金類型來看,貨幣基金成為自購主力——公募年內淨申購旗下貨幣基金14.49億元、佔比37.33%。
REITs發行回暖但估值偏冷
據Wind統計,截至7月2日,年內已有9只公募REITs成功發行,累計募資總額近237億元,數量和規模均已超去年全年水平。但從二級市場表現來看,公募REITs估值普遍處於低位。
繼7月1日大幅收跌4.5%後,7月2日開盤,中金普洛斯REIT繼續下跌,截至發稿,報3.394元,刷新近4個月價格低位。已上市交易的36只公募REITs產品中,有20只處於破發狀態,佔比約56%。且板塊內行情分化明顯,與地產行業高度相關的產業園與倉儲物流兩類產品跌幅更明顯。
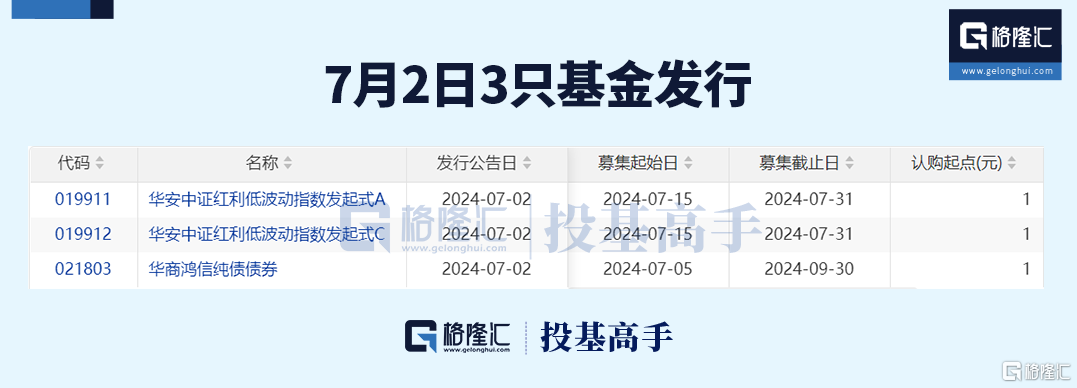
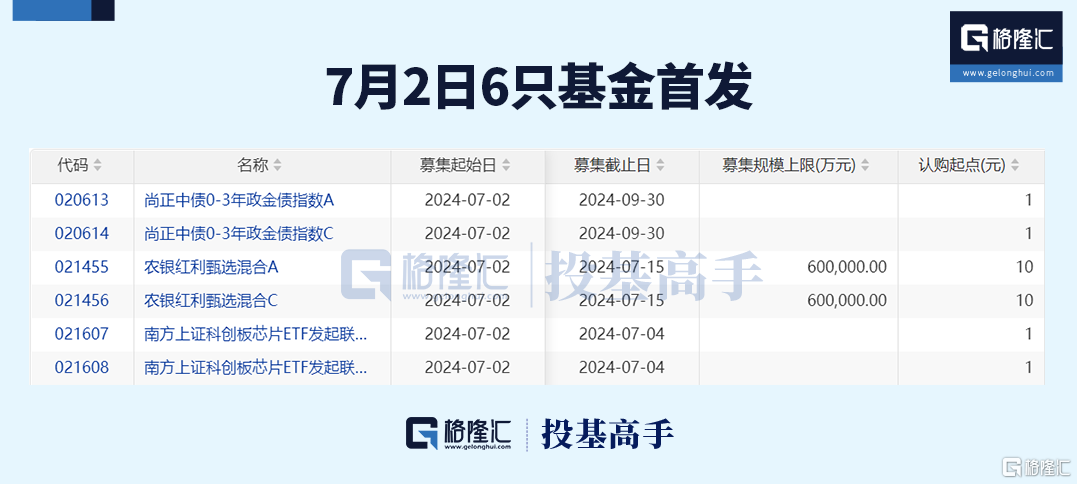
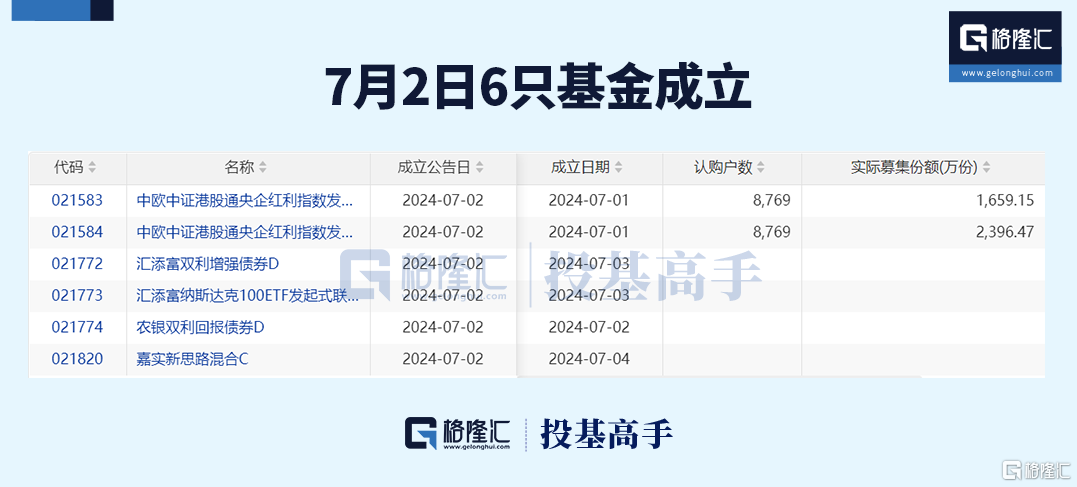
三、基金產品最新動態
Follow us
Find us on
Facebook,
Twitter ,
Instagram, and
YouTube or frequent updates on all things investing.Have a financial topic you would like to discuss? Head over to the
uSMART Community to share your thoughts and insights about the market! Click the picture below to download and explore uSMART app!

Disclaimers
uSmart Securities Limited (“uSmart”) is based on its internal research and public third party information in preparation of this article. Although uSmart uses its best endeavours to ensure the content of this article is accurate, uSmart does not guarantee the accuracy, timeliness or completeness of the information of this article and is not responsible for any views/opinions/comments in this article. Opinions, forecasts and estimations reflect uSmart’s assessment as of the date of this article and are subject to change. uSmart has no obligation to notify you or anyone of any such changes. You must make independent analysis and judgment on any matters involved in this article. uSmart and any directors, officers, employees or agents of uSmart will not be liable for any loss or damage suffered by any person in reliance on any representation or omission in the content of this article. The content of the article is for reference only and does not constitute any offer, solicitation, recommendation, opinion or guarantee of any securities, virtual assets, financial products or instruments. Regulatory authorities may restrict the trading of virtual asset-related ETFs to only investors who meet specified requirements. Any calculations or images in the article are for illustrative purposes only.
Investment involves risks and the value and income from securities may rise or fall. Past performance is not indicative of future performance. Please carefully consider your personal risk tolerance, and consult independent professional advice if necessary.


