一分鐘!南京化纖上演天地板,要成為“ST寧科”的翻版?
今日,高位股南京化纖炸板跳水,並瞬間跌停,上演“天地板”,人氣值也從第9名上升至第1名。
最新,南京化纖迴應稱:“目前,公司經營正常,股價波動是市場行為,公司基本面變化不大。”
發生了什麼?
今日一開盤,南京化纖就一字板升停,早上10:56時短暫開板,隨後回封,同時,成交量快速放大。
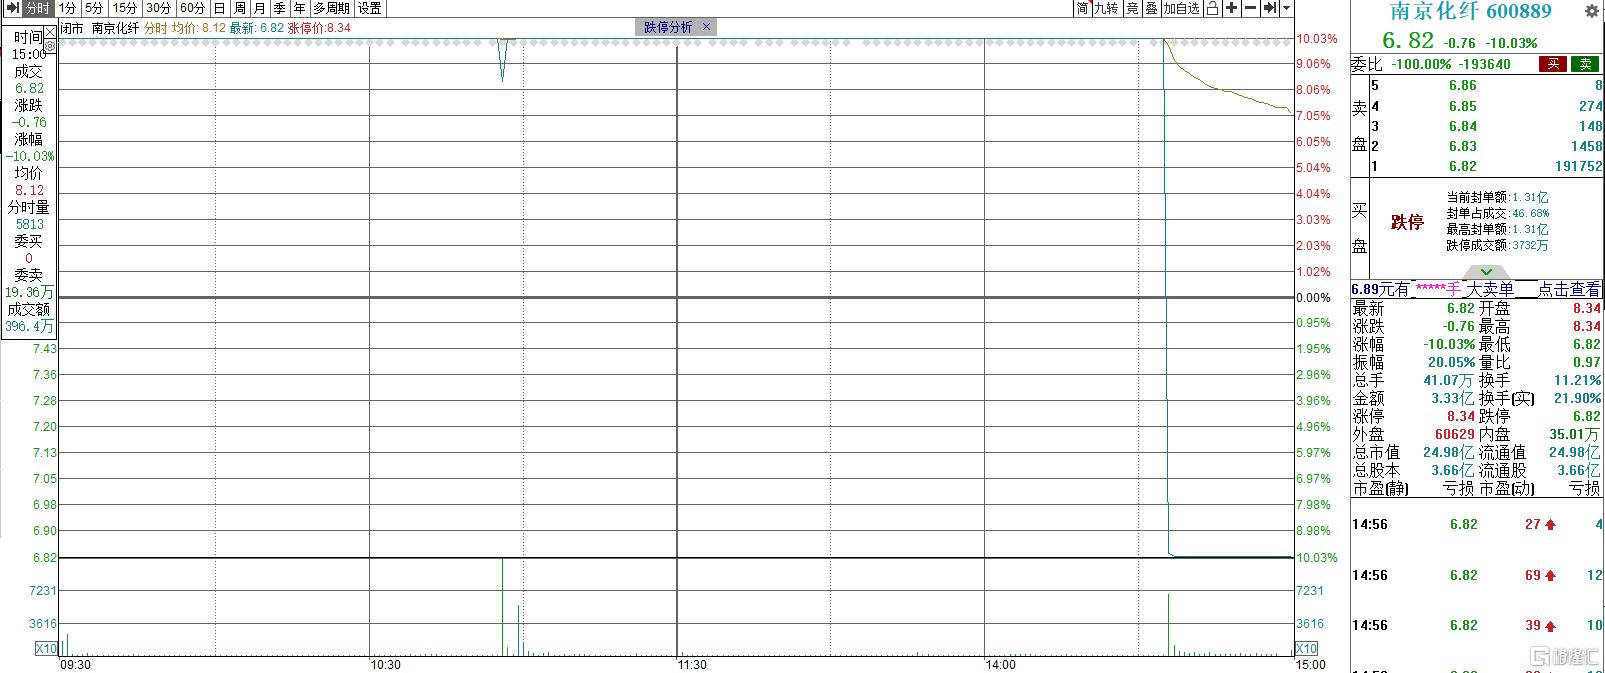
下午14:55,南京化纖開始跳水,一分鐘後就跌停了。
截至收盤,南京化纖報6.82元/股,總市值24.68億元,單日成交額3.33億元,跌停成交額3732萬元,封單額1.31億元。
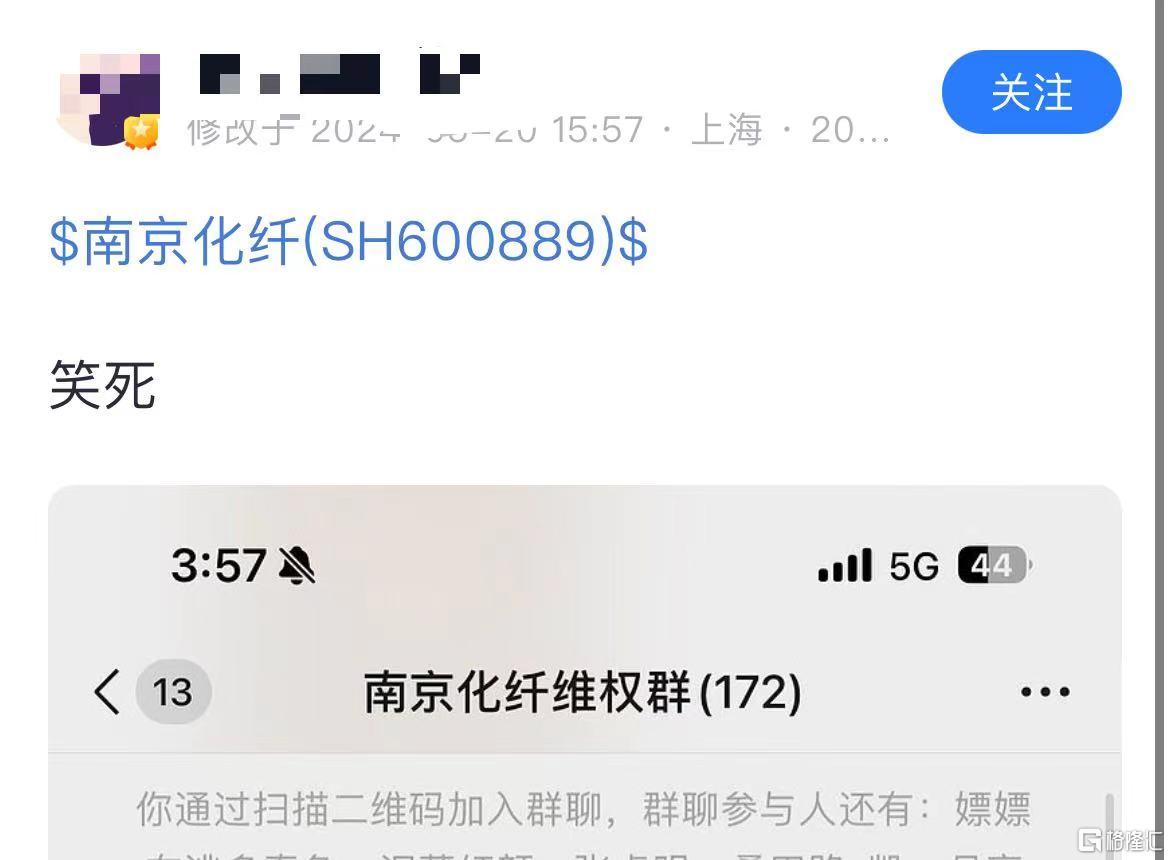
對於這樣驚心動魄的走勢,股民們直呼:“拿直尺對着都畫不出這麼直的線”,“維權羣已經建好”,“天地大面”,“又是退市前最後一拉”......
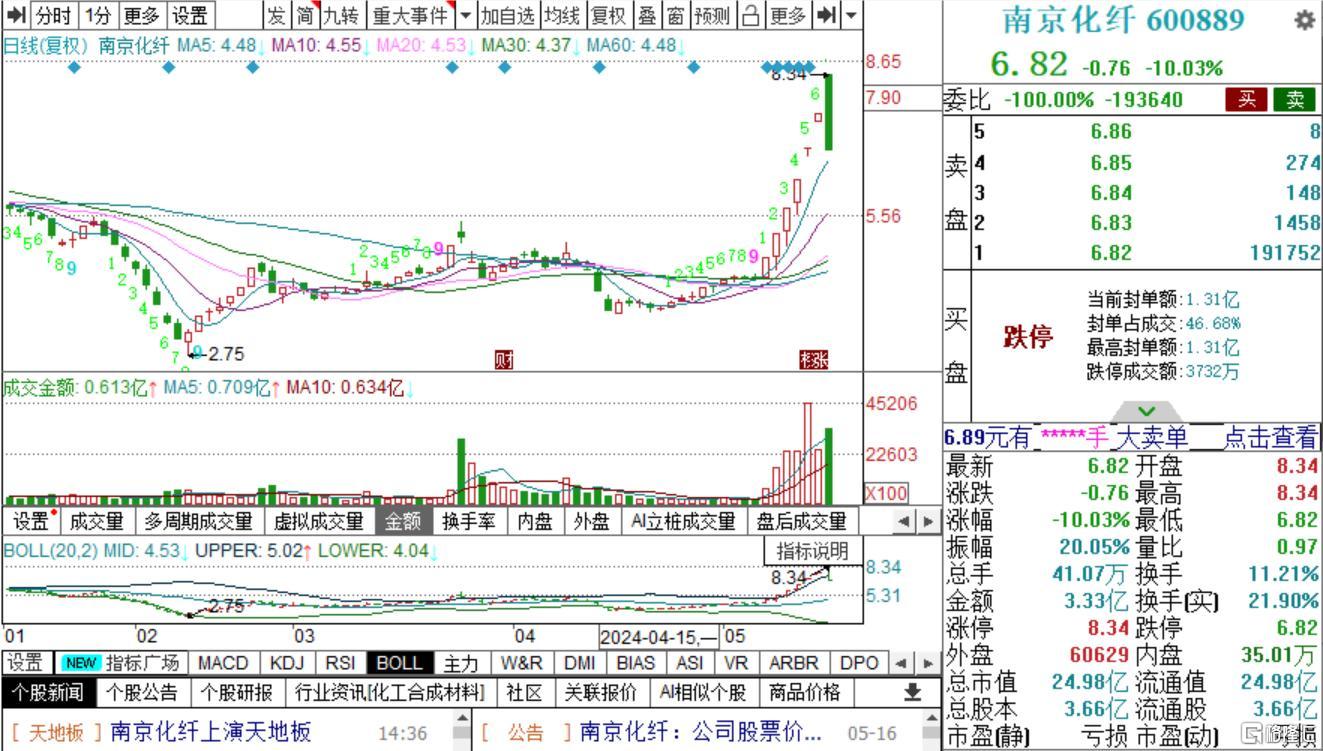
此前,南京化纖已經連續6個交易日升停,升幅達到77.52%。換手較為充分,5月10日-5月17日,換手率分別為4.09%、9.4%、11.61%、10.53%、17.92%、8.55%。
年內來看,南京化纖的股價表現也非常亮眼,從2月8日年內低點到5月17日,公司股價升幅達到150.17%,4月17日-5月17日的升幅達到109.97%。
蹭上熱點概念?
對於南京化纖股價快速上升的理由,市場猜測可能與低空經濟的火爆有關。
據悉,飛行汽車對續航時間、安全性有着很高的要求,而碳纖維具有輕質、高強度、高彈性模具、耐高低温、耐腐蝕等特性,低空經濟的快速發展能為碳纖維帶來新增量。
不過,5月14日-5月16日,南京化纖連續三天發佈了股價異常波動公吿。
南京化纖表示,目前主營業務仍為纖維素纖維、PET 結構芯材,公司生產經營情況正常,未發生重大變化。
公司未涉及其他市場熱點概念。這也意味着,南京化纖本身並不涉及碳纖維產品。
此外,因檢修停產,部分化工品升價,南京化纖所屬的化工板塊近期股價表現不錯。
存在“戴帽”風險
基本面上,南京化纖的盈利情況持續萎靡。
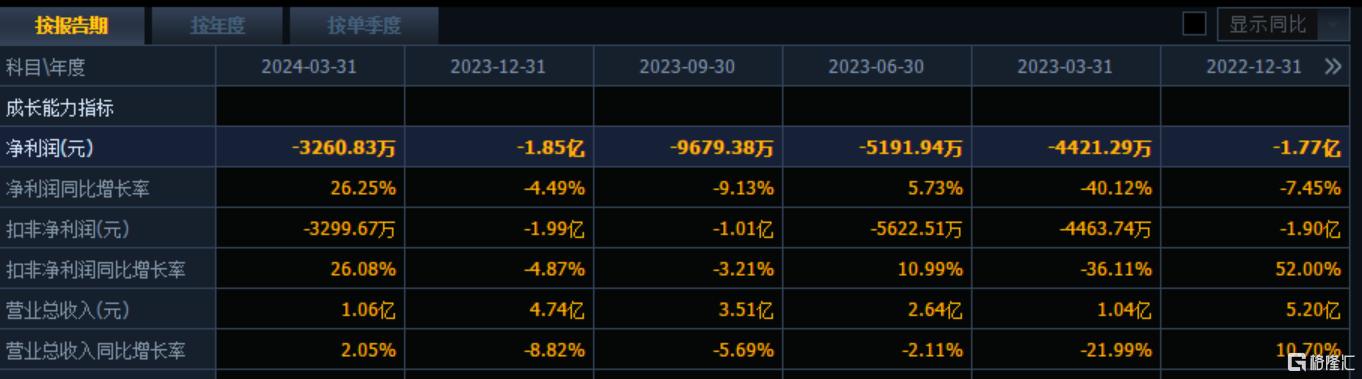
今年一季度,南京化纖實現營業總收入1.06億元,同比增長2.05%;淨利潤虧損0.33億元,同比增長26.25%。
去年全年,公司營收4.74億元,同比下滑8.82%;淨利潤虧損1.95億元,虧損幅度較前一年擴大。
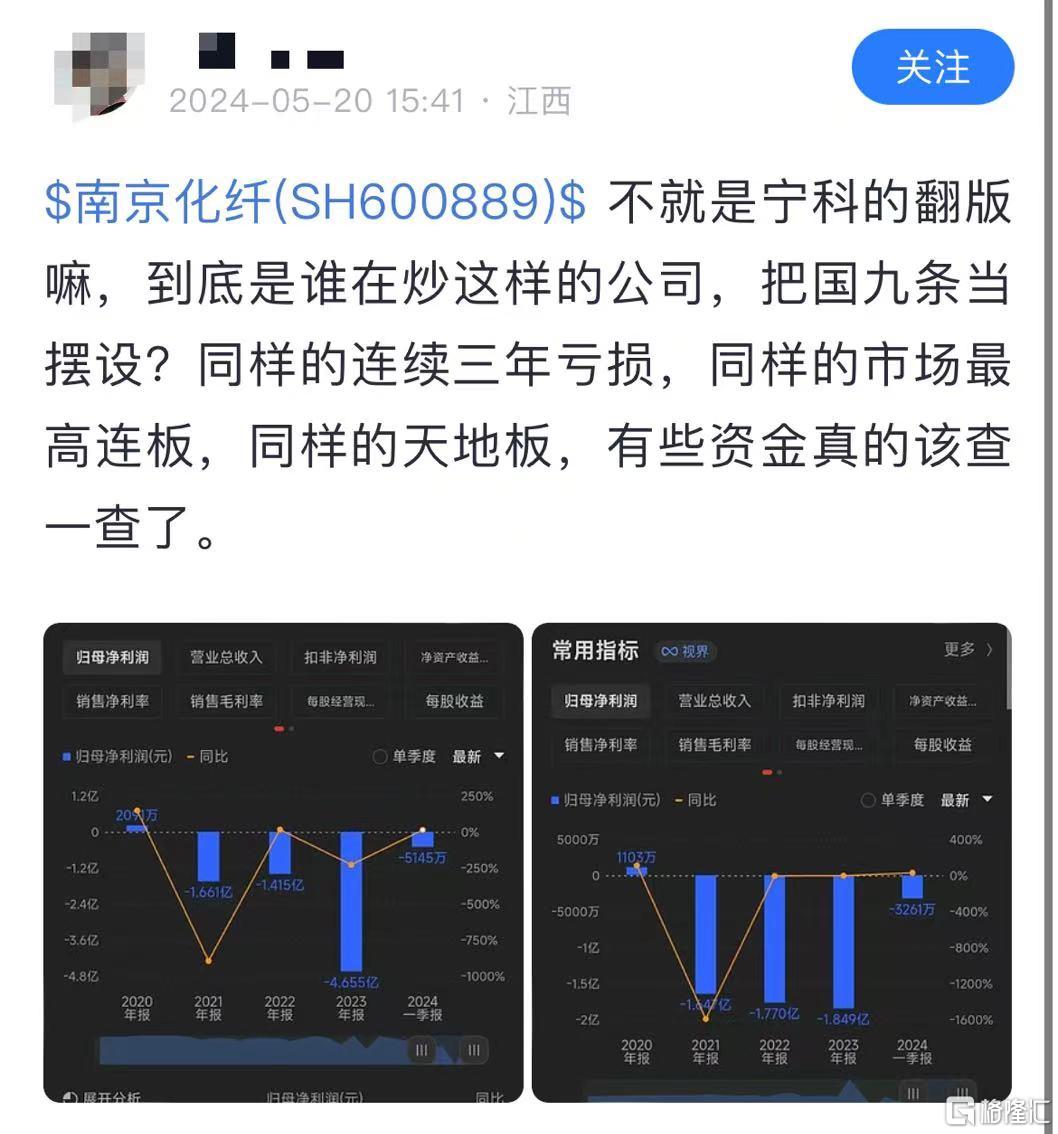
值得注意的是,南京化纖已經連續3年虧損,2021年到2023年,歸母淨利潤分別為-1.65億元、-1.77億元、-1.85億元。
對於今天這樣的極端走勢,有投資者將南京化纖與寧科對比,稱其業績已經連續3年虧損,怕被ST。
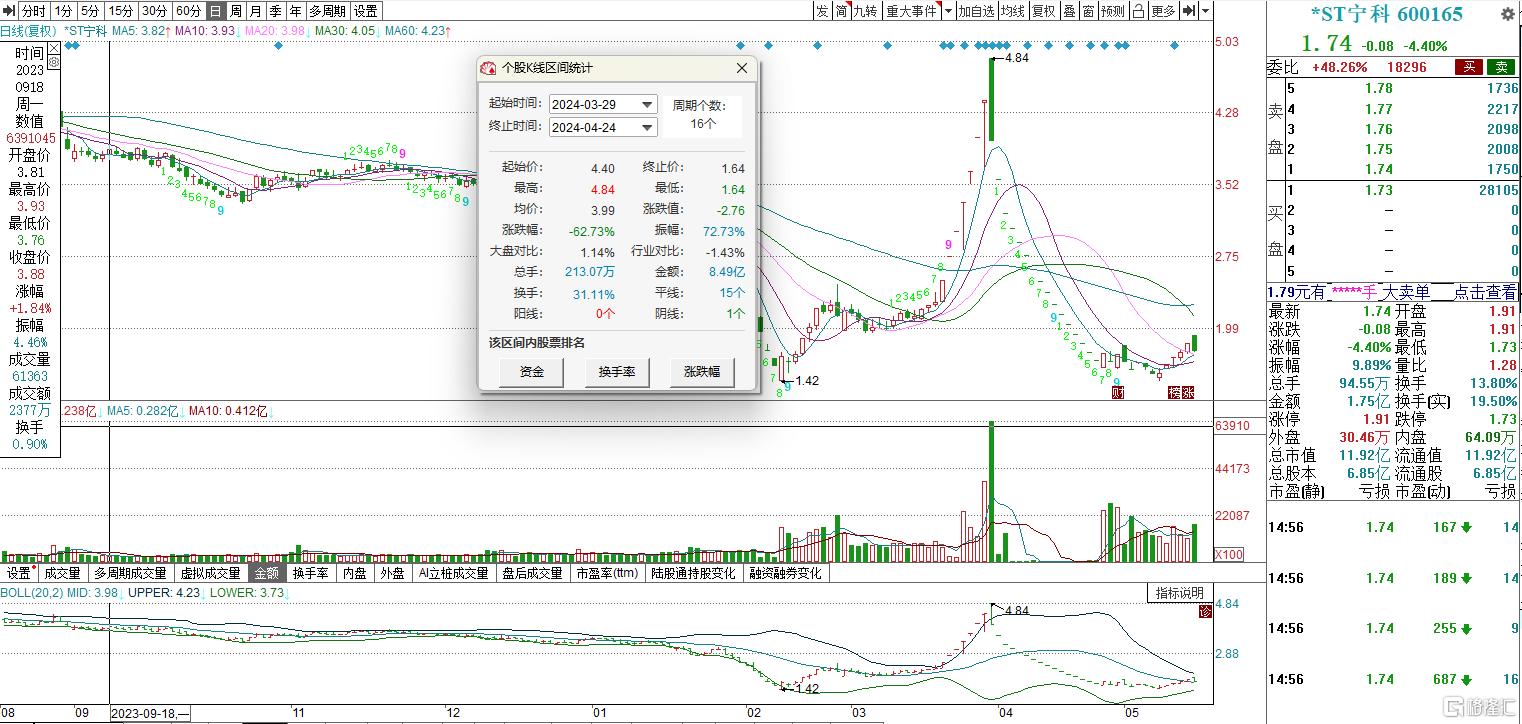
此前,*ST寧科也是在被“戴帽”前,股價大幅拉昇,於3月29日出現天地板跌停,隨後15個交易日連續一字板跌停,股價累計下跌62%。
那麼,問題來了,南京化纖接下來的走勢會複製寧科嗎?
Follow us
Find us on
Facebook,
Twitter ,
Instagram, and
YouTube or frequent updates on all things investing.Have a financial topic you would like to discuss? Head over to the
uSMART Community to share your thoughts and insights about the market! Click the picture below to download and explore uSMART app!

Disclaimers
uSmart Securities Limited (“uSmart”) is based on its internal research and public third party information in preparation of this article. Although uSmart uses its best endeavours to ensure the content of this article is accurate, uSmart does not guarantee the accuracy, timeliness or completeness of the information of this article and is not responsible for any views/opinions/comments in this article. Opinions, forecasts and estimations reflect uSmart’s assessment as of the date of this article and are subject to change. uSmart has no obligation to notify you or anyone of any such changes. You must make independent analysis and judgment on any matters involved in this article. uSmart and any directors, officers, employees or agents of uSmart will not be liable for any loss or damage suffered by any person in reliance on any representation or omission in the content of this article. The content of the article is for reference only and does not constitute any offer, solicitation, recommendation, opinion or guarantee of any securities, virtual assets, financial products or instruments. Regulatory authorities may restrict the trading of virtual asset-related ETFs to only investors who meet specified requirements. Any calculations or images in the article are for illustrative purposes only.
Investment involves risks and the value and income from securities may rise or fall. Past performance is not indicative of future performance. Please carefully consider your personal risk tolerance, and consult independent professional advice if necessary.


