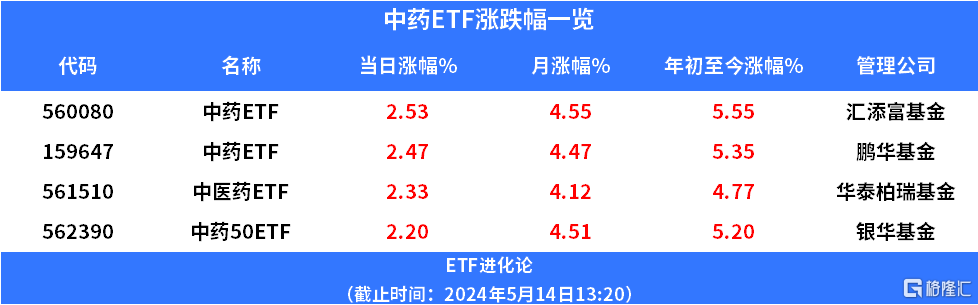
中藥材價格上升,中藥ETF創年內新高
中藥股上升,健民集團升超7%,太極集團升超6%,馬應龍、壽仙谷升超5%,鵬華基金中藥ETF(159647)升超2.6%,盤中創年內新高,自2月6日底部以來升超24%。華泰柏瑞基金中醫藥ETF、匯添富基金中藥ETF、中銀華基金中藥50ETF升超2%,月升幅超5%。
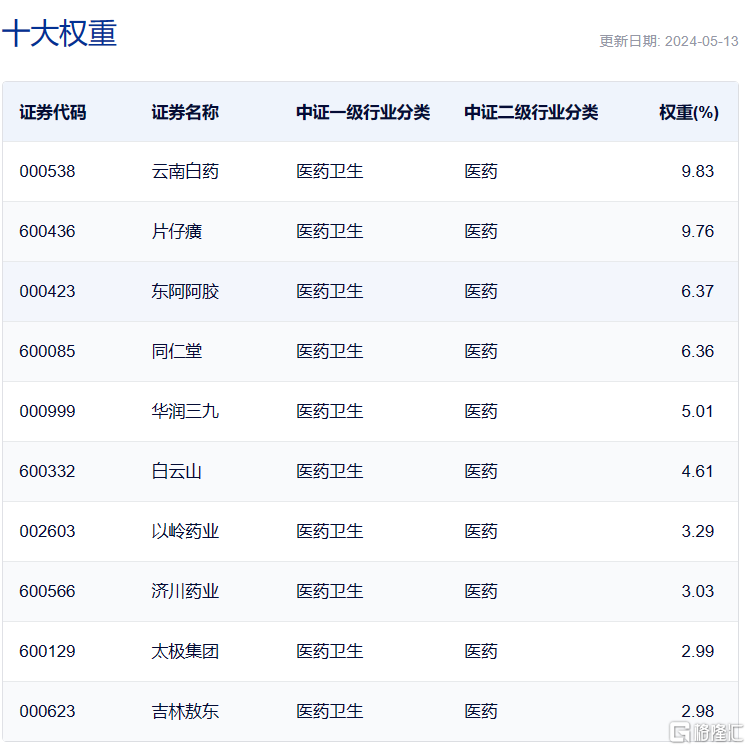
中藥ETF緊密跟蹤中證中藥指數,中證中藥指數選取涉及中藥生產與銷售等業務的上市公司證券作為樣本,以反映中藥概念類上市公司的整體表現。中證中藥指數前十大權重股分別為雲南白藥、片仔癀、東阿阿膠、同仁堂、華潤三九、白雲山、以嶺藥業、濟川藥業、太極集團、吉林敖東。
消息面上,中藥價格持續上升。根據最新發布的2024年4月份居民消費價格指數,在各類商品及服務價格單月同比變動情況中,中藥以5.4%的同比升幅位列第一。
中藥行業2023業績表現較好,2024Q1受高基數影響,增速略有放緩。
2023年年報及2024年一季報已全部披露。中藥上市公司(剔除ST、北交所、未盈利以及B股)整體表現較好。從醫藥二級子行業來看,2023年中藥行業是六個二級子行業中唯一一個實現營收、歸母淨利潤雙正增長的子行業。
2023年中藥行業營收同比增長6.2%,歸母淨利潤同比增長24.78%。2024Q1由於去年同期高基數原因,營收及歸母淨利潤增速同比略有下滑(營收同比下降0.79%,歸母淨利潤同比下降8.15%),但在二級子行業中表現依舊較好。
從增速分佈情況看,2023年中藥上市公司實現營收正增長比例為62.12%,在二級子行業中位列第三;實現扣非歸母淨利潤正增長比例為65.15%,位列二級子行業之首。其中,收入增速在20%以上的企業數量佔比為13.64%;扣非歸母淨利潤增速在20%以上的企業數量佔比為48.48%,且增速在50%以上的佔比約21.21%。
2023年中藥上市公司在營收及扣非歸母淨利潤高增速區間的表現較好。2024Q1中藥上市公司實現營收正增長比例為42.42%,實現扣非歸母淨利潤正增長比例為51.52%。從增速區間來看,收入增速在20%以上的企業數量佔比約13.64%;扣非歸母淨利潤增速在20%以上的企業數量佔比為24.24%。
湘財證券指出,中長期來看,繼續看好中藥行業。中藥行業相關政策呈現出深度上聚焦行業痛點、廣度上覆蓋全產業鏈的特點,圍繞政策特點,中藥行業或呈現結構性分化,符合政策特點的企業有望表現突出。創新為本、消費為翼,關注兩大主線:
主線一:中藥創新。在政策與臨牀需求雙驅動之下,中藥創新再度加速,新藥上市節奏加快且1類新藥佔比明顯提升。研發創新是核心,進入醫保基藥目錄是放量的重要條件:具有較強研發實力、在研產品豐富且研發進展較快、中醫理論與臨牀結合較好(尤其是能通過循證醫學改寫臨牀診治指南)、佈局大品類有獨家品種的企業;2023版醫保目錄新增品種和解禁品種及相關企業;“醫保+非基藥”品種及相關企業。
主線二:“中藥+”視角下的新消費。在政策鼓勵以及中藥“治未病”、“純天然”特有優勢下,中藥行業創新+消費雙屬性愈加明顯,行業新增長點有望來自“中藥+”視角下的新消費領域,包括零售藥店終端、品牌中藥及中藥消費品、中藥行業與多領域融合所形成的新業態等:零售藥店終端的獨家品種、OTC及雙跨品種及相關企業;品牌中藥,尤其是產業鏈向消費領域拓展的品牌中藥;向養生館、食品飲料、康養旅遊等行業探索拓展的“中藥+”企業。
Follow us
Find us on
Facebook,
Twitter ,
Instagram, and
YouTube or frequent updates on all things investing.Have a financial topic you would like to discuss? Head over to the
uSMART Community to share your thoughts and insights about the market! Click the picture below to download and explore uSMART app!

Disclaimers
uSmart Securities Limited (“uSmart”) is based on its internal research and public third party information in preparation of this article. Although uSmart uses its best endeavours to ensure the content of this article is accurate, uSmart does not guarantee the accuracy, timeliness or completeness of the information of this article and is not responsible for any views/opinions/comments in this article. Opinions, forecasts and estimations reflect uSmart’s assessment as of the date of this article and are subject to change. uSmart has no obligation to notify you or anyone of any such changes. You must make independent analysis and judgment on any matters involved in this article. uSmart and any directors, officers, employees or agents of uSmart will not be liable for any loss or damage suffered by any person in reliance on any representation or omission in the content of this article. The content of the article is for reference only and does not constitute any offer, solicitation, recommendation, opinion or guarantee of any securities, virtual assets, financial products or instruments. Regulatory authorities may restrict the trading of virtual asset-related ETFs to only investors who meet specified requirements. Any calculations or images in the article are for illustrative purposes only.
Investment involves risks and the value and income from securities may rise or fall. Past performance is not indicative of future performance. Please carefully consider your personal risk tolerance, and consult independent professional advice if necessary.


