


What is the Treasury Yield Curve?
The US Treasury Yield Curve is a plot of the yields of bonds with different maturities but the same credit quality. It includes bonds with maturities of 1 month, 2 months, 3 months, 6 months, 1 year, 2 years, 3 years, 5 years, 7 years, 10 years, 20 years, and 30 years. If we use the horizontal axis to represent the maturity of US Treasury bonds and the vertical axis to represent the corresponding yield percentage, the resulting curve is called the "yield curve" of US Treasuries.
Note: Daily and historical yields can be found on the Department of the Treasury's website.
Relationship between the Shape Types of the Yield Curve and Economic Forecasting
The shape of the yield curve can take on three main types:
· Normal Yield Curve: an upward-sloping curve
· Flat Yield Curve
· Inverted Yield Curve: a downward-sloping curve
1. Normal Yield Curve: Upward-sloping curve
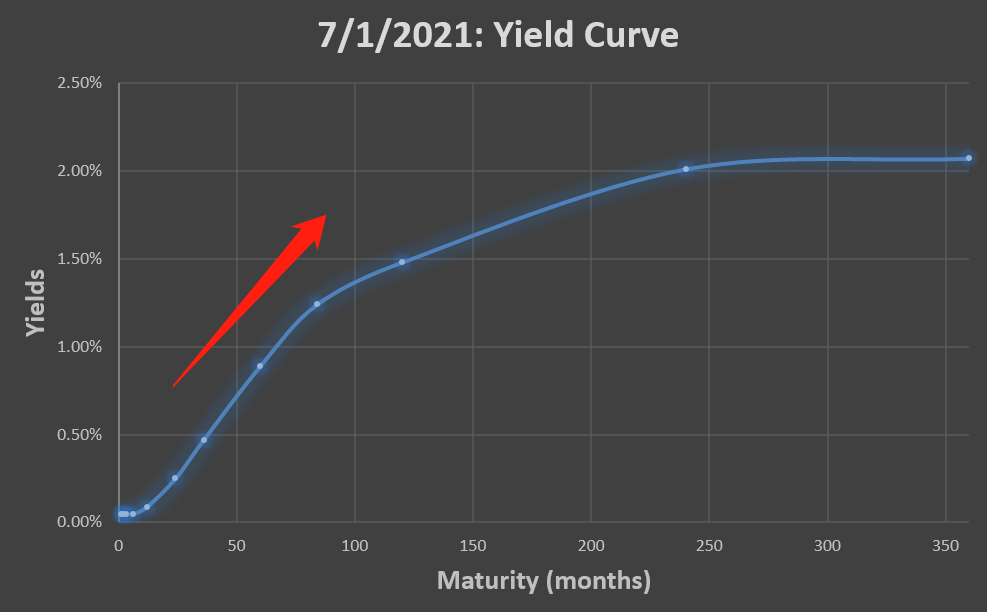 (Data Source: HowLifeUSA, 2023.08.26)
This upward-sloping yield curve is the most common in US Treasury investments. According to the issuance pattern of Treasury bonds, investors are compensated with higher returns for bearing longer time risks. Therefore, long-term interest rates are typically higher than short-term interest rates.
A normal upward-sloping yield curve often indicates market optimism about future economic growth. Lower yields on shorter-term bonds compared to longer-term bonds may imply market expectations of sustained economic growth and potential increases in interest rates.
Additionally, there may be other aspects of economic forecasting:
· Inflation expectations: Higher yields on longer-term US bonds compared to shorter-term bonds may suggest market expectations of increasing inflation pressures in the future. Typically, there exists a positive correlation between economic growth and inflation.
· Monetary policy expectations: Higher yields on longer-term US bonds may indicate market expectations of potential future rate hikes by the Federal Reserve. The Fed usually responds to inflation pressures and signs of an overheating economy by raising short-term interest rates.
· Lending conditions and risk appetite: Provides some insights into lending conditions and market risk appetite. Higher yields on longer-term US bonds may reflect some market concerns about future risks. Furthermore, lower yields on shorter-term US bonds may reflect market demand for short-term economic stability and a preference for lower risk.
2. Flat Yield Curve
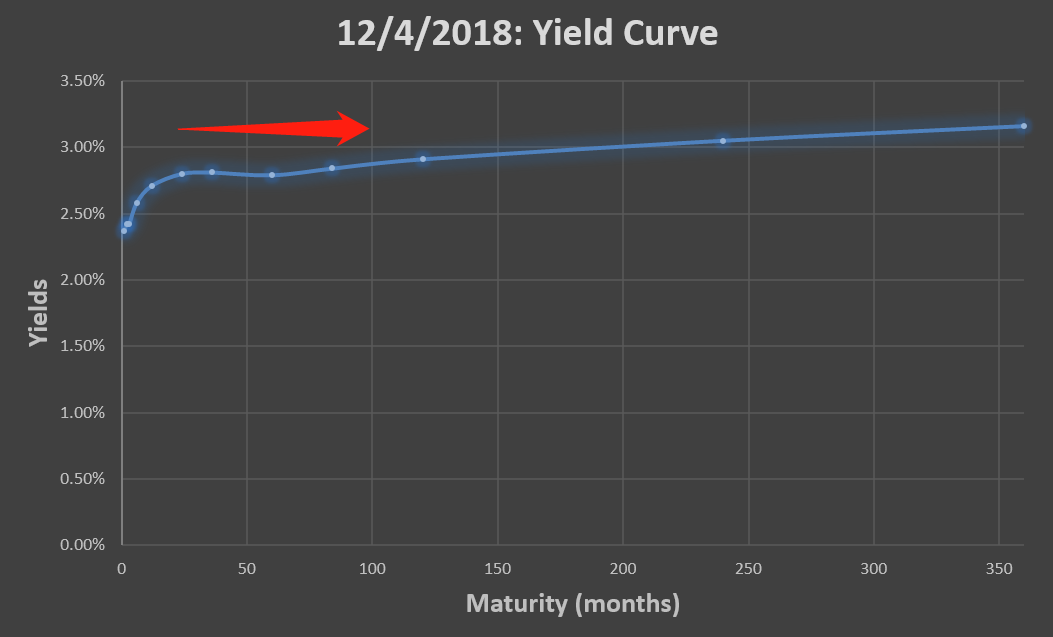 (Data Source: HowLifeUSA, 2023.08.26)
A flat-shaped US Treasury yield curve typically suggests a more conservative market outlook for future economic growth. In a flat yield curve, there is little difference between the yields of shorter-term and longer-term bonds, indicating a more stable or uncertain expectation for economic growth.
Other economic forecasts may include:
· Inflation expectations: Due to the minimal difference in yields between shorter-term and longer-term bonds, the market may anticipate relatively lower inflation pressures in the future.
· Monetary policy expectations: When the yield curve flattens, the market may expect the central bank to maintain the current interest rate levels and monetary policy stance, indicating a lack of significant economic demand or inflation pressures.
· Lending conditions and risk appetite: It may reflect a more cautious risk appetite in the market. With little difference in yields between shorter-term and longer-term bonds, it suggests heightened market concern for risks, and investors may lean toward conservative investment strategies.
3. Inverted Yield Curve: a downward-sloping curve
 (Data Source: HowLifeUSA, 2023.08.26)
At this time, when short-term bond yields are higher than long-term bond yields, it can be understood as an 'inverted yield curve.
An inverted-shaped US Treasury yield curve is generally seen as a precursor or warning signal of an economic recession. Typically, the yields on longer-term US bonds are lower than those on shorter-term bonds, indicating market concerns about future economic recession. This curve shape suggests that investors have a more pessimistic outlook on short-term economic prospects and may anticipate the need for future interest rate cuts to stimulate the economy.
Additionally, it may also reflect market expectations for future interest rate cuts and the presence of hedging demand. As longer-term US bond yields are lower than shorter-term bond yields in an inverted shape, it may imply market expectations of future rate cuts by the central bank to address downward economic risks. Investors may tend to purchase longer-term US bonds, causing their yields to decline, as a means of avoiding potential risks in risk assets or the stock market.
Why does an inverted yield curve occur? How to track it?
When economic uncertainty increases, such as concerns about interest rate cuts, trade wars, global economic slowdown, geopolitical risks, etc., investors tend to buy long-term bonds. This leads to an increase in demand for longer-term bonds, driving up their prices and lowering yields. In contrast, the demand for shorter-term bonds is relatively lower, resulting in relatively higher yields, and ultimately causing an inverted yield curve.
Economist Campbell Harvey, who discovered that the US Treasury yield curve can predict economic recessions, has a model that shows when the 3-month Treasury yield exceeds the 10-year Treasury yield for more than 3 months- formally known as an inversion – an economic recession will follow.
According to Harvey,as of January 2024, these two bonds have been officially inverted for 12 months. The average time for the yield curve to invert before the past four US economic recessions was 13 months, indicating that an economic recession may be imminent.
In addition to observing the shape of the yield curve (normal, flat, or inverted) on a daily basis, we can also track it by calculating the difference between long-term and short-term bond yields. For example, the 10-year bond yield can represent long-term bonds, while the 3-month bond yield can represent short-term bonds, and we can monitor whether the difference between the two is less than 0. The formula for calculating the yield difference is: Yield Difference = 10-Year Bond Yield -3-Month Bond Yield. If it is less than 0, it can be considered as an inversion.
How to use the yield curve for economic forecasting and risk management
1. Observe the difference between long-term and short-term interest rates and monitor changes in the yield curve.
In normal circumstances, long-term interest rates should be higher than short-term interest rates. If an inverted curve occurs, it may indicate an increased risk of an economic recession. This can serve as an early warning sign of an economic recession, but it's not an absolute indicator.
2. Adjust the proportion of hedging assets in the investment portfolio based on the shape of the yield curve.
During an economic recession or increased uncertainty, increase the proportion of relatively safe hedging assets (such as bonds) to reduce portfolio risk.
3. Manage interest rate sensitivity by adjusting the allocation of fixed-income assets in the investment portfolio.
In anticipation of rising interest rates, reduce holdings of long-term fixed-income assets sensitive to interest rate changes.
4. Utilize trading opportunities based on interest rate differentials between different maturities.
For example, if interest rates are expected to decline, one may choose to invest in longer-term bonds to achieve higher returns.


More Content


