You are browsing the Hong Kong website, Regulated by Hong Kong SFC (CE number: BJA907). Investment is risky and you must be cautious when entering the market.
收入下降18%!植物肉巨頭Beyond Meat Q1業績喜憂參半,盤後大跌逾13%
格隆匯 05-09 10:20

美股週三盤後,“人造肉第一股Beyond Meat公佈最新季度財報。

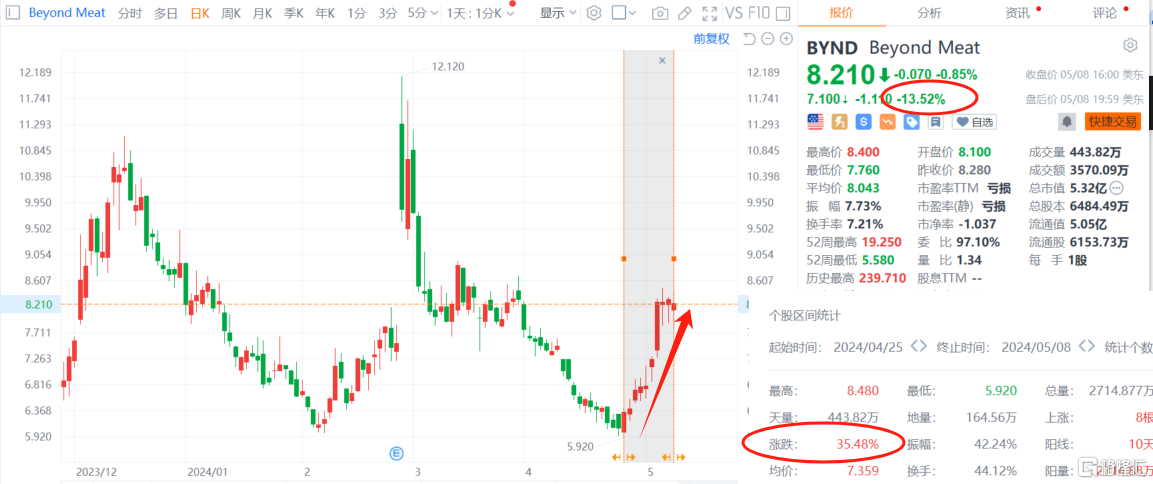
由於需求疲軟、產品銷量的下滑,公司 Q1 業績喜憂參半;受此影響,公司股價盤後跌超13%。

今年迄今為止,Beyond Meat的股價上演了一輪“W”走勢,累計下跌了近8%。

2月底以來,公司股價持續下行了近2個月;不過自4月25起又重拾升勢,期間累計升幅超過35%。

銷量下滑

財報顯示,Beyond Meat第一季度收入同比下降 18% 至 7560.3 萬美元,超出預期的7524.1萬美元,去年同期為 9220萬美元。這是該公司收入連續第八個季度同比下降。

下降的主要原因是產品銷量下降 16.1%,每磅淨收入下降2.3%。

第一季度毛利潤為 370 萬美元,毛利率為 4.9%,去年同期毛利潤為 620 萬美元,毛利率為 6.7%。

運營虧損為 5350 萬美元,運營利潤率為 -70.7%,去年同期運營虧損為 5770 萬美元,運營利潤率為 -62.6%。調整後的運營虧損為 4600 萬美元,調整後的運營利潤率為 -60.8%。

淨虧損為 5440 萬美元,即每股虧損 0.84 美元,上年同期虧損0.92美元。調整後淨虧損為 4690 萬美元,即稀釋後普通股每股 0.72 美元。

調整後EBITDA虧損3290萬美元,佔淨收入的 -43.5%,分析師預期虧損2870萬美元。

一季度公司運營費用為 5710 萬美元,而去年同期為 6390 萬美元。

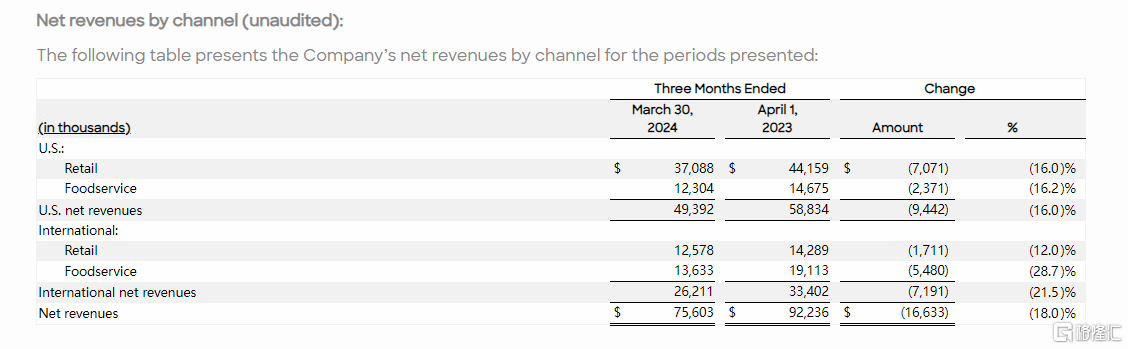
按渠道劃分的淨收入來看,第一季度美國淨營收4940萬美元,分析師預期4400萬美元。

其中,美國零售渠道淨收入下降 16.0%,至 3710 萬美元,而去年同期為 4420 萬美元,主要是由於產品銷量下降 10.2%。

美國餐飲服務渠道淨收入下降 16.2%,至 1230 萬美元,而去年同期為 1470 萬美元,主要是由於銷售產品數量減少 20.7%

第一季度國際淨營收2620萬美元,分析師預期3240萬美元。

其中,國際零售渠道淨收入下降 12.0%,至 1260 萬美元,而去年同期為 1430 萬美元,主要是由於產品銷量下降 12.7%。

國際餐飲服務渠道淨收入下降 28.7%,至 1,360 萬美元,而去年同期為 1,910 萬美元,主要原因是產品銷量下降 25.0%。

2024,關鍵的一年

儘管銷量的下降打壓了業績,但Beyond首席執行官伊桑·布朗仍然保持信心。

伊桑·布朗在一份聲明中表示,Beyond Meat同比減少了運營支出和現金消耗,將生產引入內部以降低成本和提高質量。他相信公司推出的漢堡和牛肉產品將幫助公司反彈。

“我們希望帶回那個可能已經被嚇跑的非常親密和早期採用的消費者。”
“除了我們正在探索的加強資產負債表的措施外,我們還將繼續努力將2024年定位為關鍵的一年,因為我們努力實現可持續和盈利的運營。”

不過Beyond Meat也提醒,公司的運營環境繼續受到與宏觀經濟問題有關的不確定性的影響。

其中包括了對植物性肉類需求持續進一步減弱、通貨膨脹和高利率以及對經濟衰退可能性的擔憂等等因素。

Beyond Meat預計,整個財年淨營收在 3.15 億美元至 3.45 億美元之間,分析師預期3.298億美元。第二季度淨收入預計在 8500 萬美元至 9000 萬美元之間。

預計 2024 年全年毛利率將在中位數至高位數範圍內,下半年毛利率預計將高於上半年。

運營支出(不包括與消費者集體訴訟和解相關的 750 萬美元應計費用)預計將在 1.7 億至 1.9 億美元之間,今年上半年的比重略高。資本支出預計在 1500 萬至 2500 萬美元之間。

對此,eMarketer 分析師布萊克·德羅施 (Blake Droesch) 表示,對於植物性行業來説,這仍然是一場艱苦的戰鬥,因為消費者仍在勒緊褲腰帶,不太可能嘗試新的優質雜貨品牌。

Follow us
Find us on Facebook, Twitter , Instagram, and YouTube or frequent updates on all things investing.Have a financial topic you would like to discuss? Head over to the uSMART Community to share your thoughts and insights about the market! Click the picture below to download and explore uSMART app!
Disclaimers
uSmart Securities Limited (“uSmart”) is based on its internal research and public third party information in preparation of this article. Although uSmart uses its best endeavours to ensure the content of this article is accurate, uSmart does not guarantee the accuracy, timeliness or completeness of the information of this article and is not responsible for any views/opinions/comments in this article. Opinions, forecasts and estimations reflect uSmart’s assessment as of the date of this article and are subject to change. uSmart has no obligation to notify you or anyone of any such changes. You must make independent analysis and judgment on any matters involved in this article. uSmart and any directors, officers, employees or agents of uSmart will not be liable for any loss or damage suffered by any person in reliance on any representation or omission in the content of this article. The content of the article is for reference only and does not constitute any offer, solicitation, recommendation, opinion or guarantee of any securities, virtual assets, financial products or instruments. Regulatory authorities may restrict the trading of virtual asset-related ETFs to only investors who meet specified requirements. Any calculations or images in the article are for illustrative purposes only.
Investment involves risks and the value and income from securities may rise or fall. Past performance is not indicative of future performance. Please carefully consider your personal risk tolerance, and consult independent professional advice if necessary.
uSMART
Wealth Growth Made Easy
Open Account