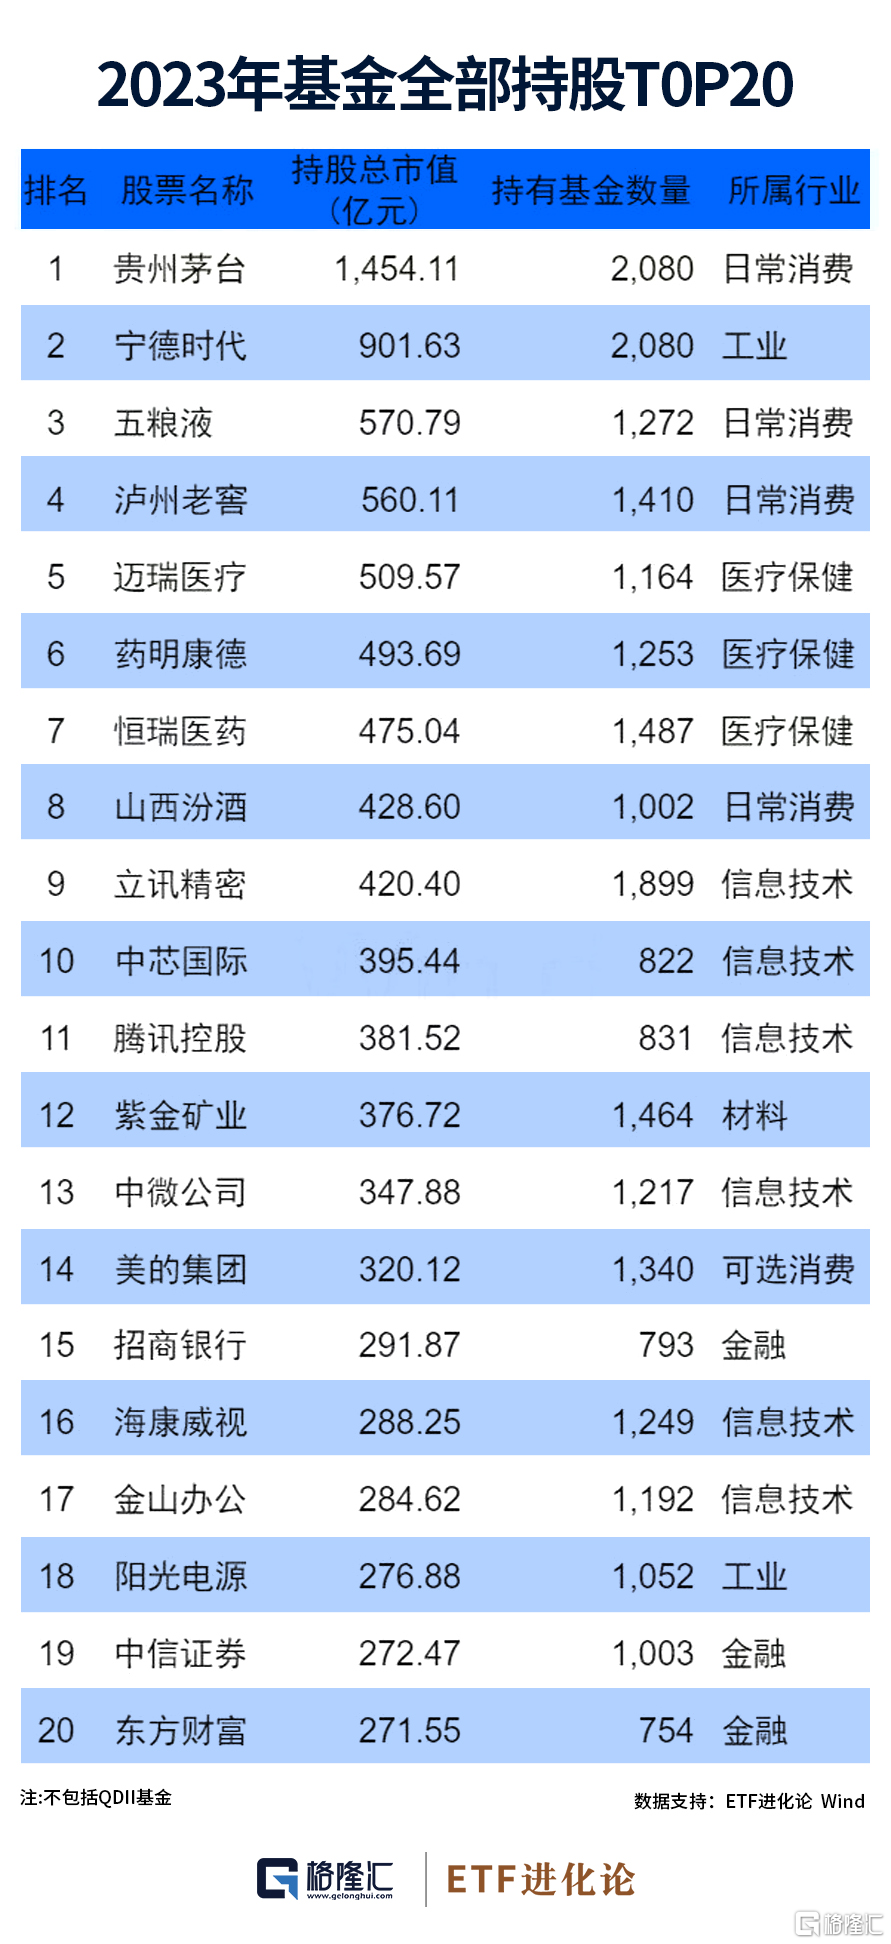
2023年公募基金全部持股TOP20明細公佈
2023年公募基金年報披露完畢,2023年公募基金規模已達27.27萬億元,同比增長5.89%。
從重倉股看,據Wind統計,2023年日常消費、信息技術、醫療保健行業頗受投資者青睞。其中,貴州茅台持股總市值仍位列第一,達1454.11億元,被2080只基金持有。
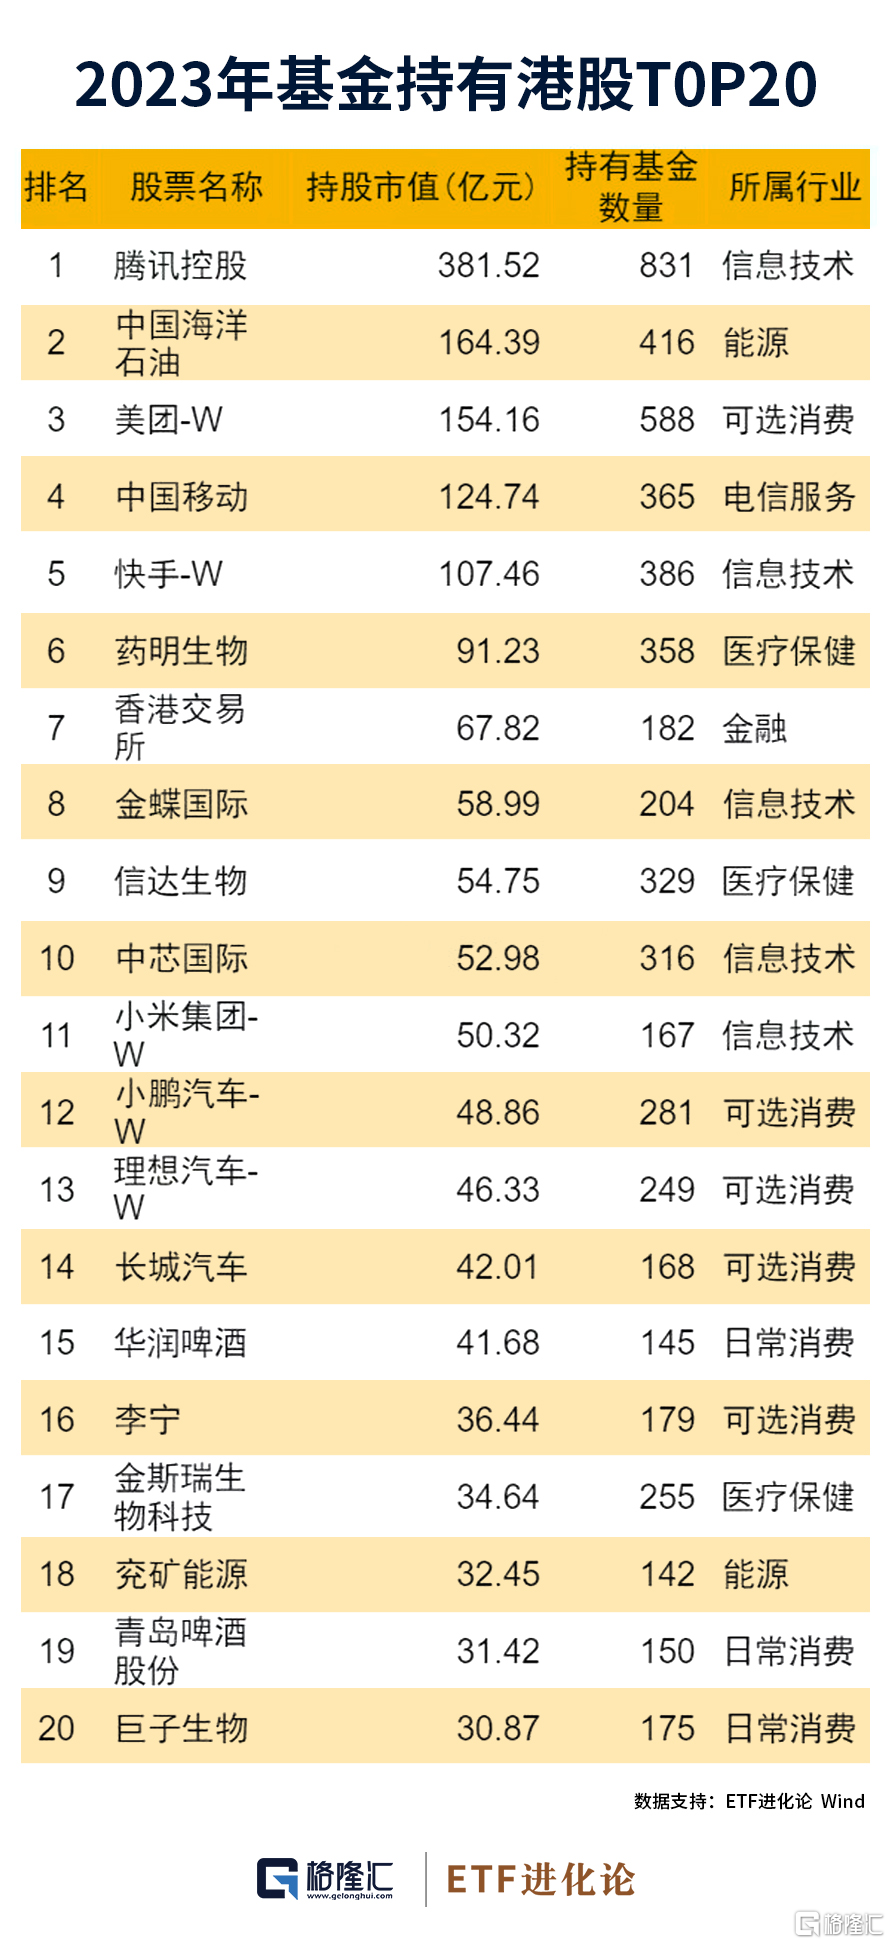
港股資產配置中,2023年公募基金對騰訊控股持股總市值381.52億元,持有基金數量831只。
海通證券梳理了2023年基金年報,得出:
1、科創板配比進一步提升,主板佔比繼續下降。根據2023年基金年報數據,截至2023年12月31日,主動股混基金在滬深主板持股市值佔比約62.19%,較2023年中報下滑0.90%。細分板塊方面,上海主板和深圳主板的佔比分別為36.39%和25.80%,相較2023年中報分別上升1.34%和下降2.24%;在創業板、科創板和港股的配置比例分別為17.64%、13.38%和6.71%,相較2023年中報分別下降0.57%、上升1.62%和下降0.16%。整體來看,主動股混基金2023年下半年在科創板的佔比提升較為明顯,而在港股和創業板的配比變化不大。
2、行業配置,增持醫藥和電子,減持電力設備和計算機。截至2023年末,公募主動股混基金前五大布局行業分別是醫藥生物、電子、食品飲料、電力設備和計算機。剔除由行業升跌所導致的持倉結構被動變化後,2023年下半年,主動股混基金主動增持電子和醫藥生物等行業,主動增持幅度分別為1.89%和1.27%;相反地,在計算機行業的配置比例大幅下降,其中主動減持的比例為1.56%,由行業升跌所導致的被動減持幅度約為0.46%。電力設備行業遭主動減持的幅度也較大,達1.19%,行業下跌導致的被動減持比例約1.78%。
3、權益前20大公募管理公司,主動加倉醫藥和電子至重倉,主動減持計算機。2023年末,醫藥和電子是主動權益規模較大的公募公司持倉權重最高的兩大行業。在20家公司中,分別有18家和17家的前三大行業中出現了醫藥生物和電子行業。從主動增減倉情況來看,2023年下半年,這20家公司中分別有6家和5家選擇大幅主動提升醫藥生物和電子行業的配置比例。其次,主動提升有色金屬、煤炭和機械設備行業比例最大的公司也各有2家。相反地,2023年下半年有8家大中型主動權益公司選擇主動減持計算機行業。
4、高倉位基金換手率同比整體上升,2023年全年,各類型主動股混基金的總換手率為224.27%,相較於2022年,同比上升6.05%。其中,平衡混合型基金的換手率較低,為178.25%;靈活策略混合型基金的倉位可變動範圍較大,給予基金經理較大的調倉空間,故換手率最高,為253.46%,但相較於2022年而言下降了10.78%。此外,主動股票開放型和強股混合型基金的換手率有所提升,分別同比上升了23.92%和6.05%。綜合來看,2023年高倉位基金的換手率較2022年整體有增長。
5、抱團度下降,醫藥個股持有市值增加。2023年末,主動股混基金持股市值排名前1%個股合計市值約佔到基金總股票投資市值的26.99%,相較2023年6月末(27.87%)有所下降,而位於後80%的個股佔比則提升0.77%,可見公募基金“抱團”程度有所下降。持股市值前十的個股中有4只白酒股,3只來自醫藥的CXO、創新藥和醫療器械子行業,1只新能源電池個股,1只消費電子元件個股以及1只互聯網港股。整體來看,3家醫藥公司在2023年下半年均得到機構增持,而新能源產業鏈相關個股上榜數量有所減少。
Follow us
Find us on
Facebook,
Twitter ,
Instagram, and
YouTube or frequent updates on all things investing.Have a financial topic you would like to discuss? Head over to the
uSMART Community to share your thoughts and insights about the market! Click the picture below to download and explore uSMART app!

Disclaimers
uSmart Securities Limited (“uSmart”) is based on its internal research and public third party information in preparation of this article. Although uSmart uses its best endeavours to ensure the content of this article is accurate, uSmart does not guarantee the accuracy, timeliness or completeness of the information of this article and is not responsible for any views/opinions/comments in this article. Opinions, forecasts and estimations reflect uSmart’s assessment as of the date of this article and are subject to change. uSmart has no obligation to notify you or anyone of any such changes. You must make independent analysis and judgment on any matters involved in this article. uSmart and any directors, officers, employees or agents of uSmart will not be liable for any loss or damage suffered by any person in reliance on any representation or omission in the content of this article. The content of the article is for reference only and does not constitute any offer, solicitation, recommendation, opinion or guarantee of any securities, virtual assets, financial products or instruments. Regulatory authorities may restrict the trading of virtual asset-related ETFs to only investors who meet specified requirements. Any calculations or images in the article are for illustrative purposes only.
Investment involves risks and the value and income from securities may rise or fall. Past performance is not indicative of future performance. Please carefully consider your personal risk tolerance, and consult independent professional advice if necessary.


