百元股破發!浩辰軟件科創板上市,股價跌超13%!
10月10日,蘇州浩辰軟件股份有限公司(以下簡稱“浩辰軟件”)登陸科創板,保薦人為中信建投證券。本次發行價格103.40元/股,發行市盈率77.77倍,截至發稿時間,最新總市值約40億元。
浩辰軟件是國內的研發設計類工業軟件提供商,主要從事 CAD 相關軟件的研發及推廣銷售業務。
本次發行前,胡立新為公司的控股股東和實際控制人,其直接持有公司 16.03%的股份並通過星永宇合夥間接控制公司 3.57%的股份,同時胡立新與陸翔、鄧力羣、梁江、潘立、梁海霞簽署一致行動人協議,合計控制公司 47.12%的表決權。
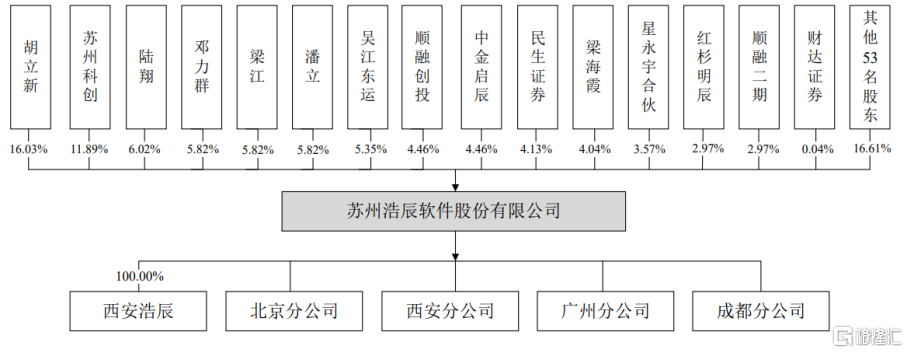
股權結構圖,圖片來源:招股書
本次IPO擬募集的資金主要用於跨終端 CAD雲平台研發項目、2D CAD平台軟件研發升級項目、3D BIM平台軟件研發項目等。
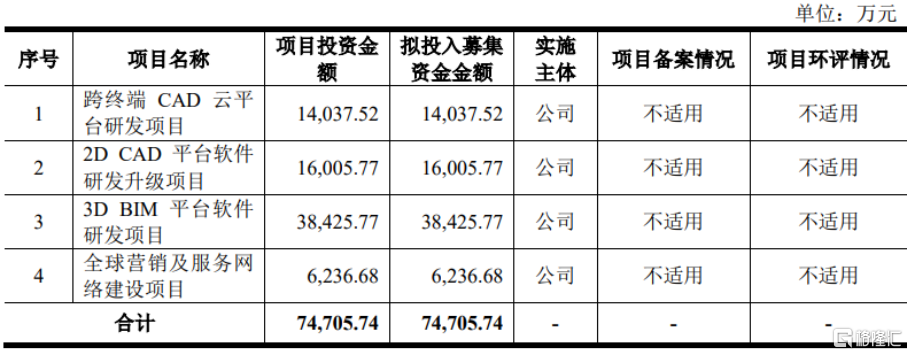
募資使用情況,圖片來源:招股書
報吿期內,浩辰軟件實現營收分別為1.86億元、2.36億元、2.41億元,歸屬於母公司所有者的淨利潤分別為4811.93萬元、7010.53萬元、6227.3萬元。
可以發現,2022 年度營業收入增速有所放緩,這一主要原因為 2022 年度公司銷售推廣活動受到一定限制,導致境內 CAD 軟件業務收入有所下降,以及境內廣吿位投放策略調整、上半年廣吿行業整體市場的投放需求疲軟導致互聯網廣吿業務收入有所下降。
由於 2022 年度營業收入增速減緩,且員工人數增加致使薪酬開支等費用有所上升,導致 2022 年度歸屬於母公司股東的淨利潤、扣除非經常性損益後歸屬於母公司股東的淨利潤均有所下降。
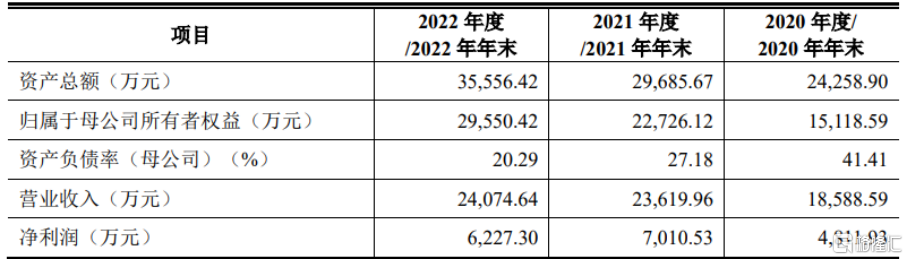
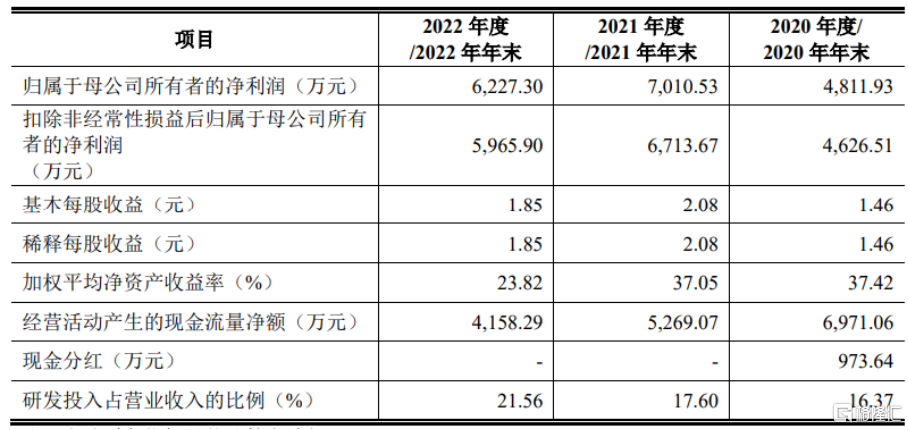
基本面情況,圖片來源:招股書
報吿期內,浩辰軟件的主營業務毛利率分別為 92.75%、92.67%、91.95%,出現下滑趨勢。
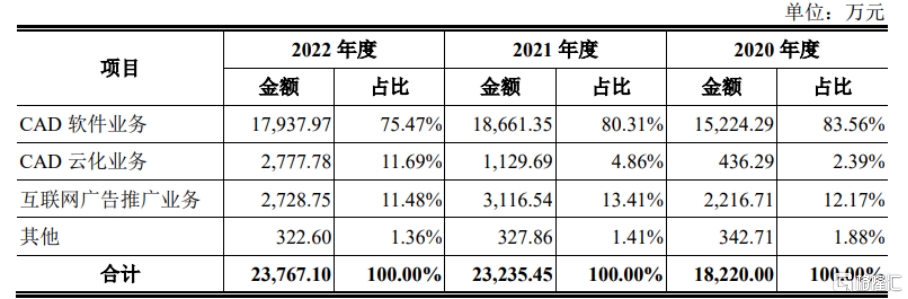
主營業務按業務類型分類情況,圖片來源:招股書
浩辰軟件的主要產品包括 2D CAD 軟件和浩辰 CAD 看圖王等。其中,公司主要產品 2D CAD 收入佔比較高。根據艾瑞諮詢,2020 年全球 CAD 市場規模近 100 億美元,其中 2D CAD 市場規模約 26 億美元。綜合艾瑞諮詢針對中國 CAD 市場的測算以及艾瑞諮詢、BIS Research 對於全球 2D CAD 和 3D CAD 市場結構的測算,2020 年和 2023 年中國 2D CAD 市場規模分別為 9.2 億元和 16.9 億元,總體規模較小。
報吿期各期,浩辰軟件的境外銷售收入佔主營業務收入比例分別為 36.44%、29.13%、30.04%。境外收入主要集中在亞洲及歐洲,收入保持穩定增長趨勢。2019 年以來,持續進行的國際貿易摩擦導致中資企業國際市場業務開拓出現阻力。上述因素使得公司境外業務發展不確定性增加。
值得注意的是,2015 年起,發行人曾與 ITC 發生知識產權糾紛,並已於 2021 年 4 月達成全球範圍內的全面最終和解。
Follow us
Find us on
Facebook,
Twitter ,
Instagram, and
YouTube or frequent updates on all things investing.Have a financial topic you would like to discuss? Head over to the
uSMART Community to share your thoughts and insights about the market! Click the picture below to download and explore uSMART app!

Disclaimers
uSmart Securities Limited (“uSmart”) is based on its internal research and public third party information in preparation of this article. Although uSmart uses its best endeavours to ensure the content of this article is accurate, uSmart does not guarantee the accuracy, timeliness or completeness of the information of this article and is not responsible for any views/opinions/comments in this article. Opinions, forecasts and estimations reflect uSmart’s assessment as of the date of this article and are subject to change. uSmart has no obligation to notify you or anyone of any such changes. You must make independent analysis and judgment on any matters involved in this article. uSmart and any directors, officers, employees or agents of uSmart will not be liable for any loss or damage suffered by any person in reliance on any representation or omission in the content of this article. The content of the article is for reference only and does not constitute any offer, solicitation, recommendation, opinion or guarantee of any securities, virtual assets, financial products or instruments. Regulatory authorities may restrict the trading of virtual asset-related ETFs to only investors who meet specified requirements. Any calculations or images in the article are for illustrative purposes only.
Investment involves risks and the value and income from securities may rise or fall. Past performance is not indicative of future performance. Please carefully consider your personal risk tolerance, and consult independent professional advice if necessary.


