中金:對未來半年出口可以樂觀一些
本文來自格隆匯專欄:中金研究;作者:鄭宇馳 張文朗
摘要
2023年8月以美元計價出口同比-8.8%(7月為-14.5%)、進口同比-7.3%(7月為-12.4%),出口基本符合市場預期,進口降幅收窄程度高於市場預期(Bloomberg出口、進口市場預期皆為-9.0%)。基數效應是出口降幅收窄的主要貢獻因素,而排除基數效應後,進口邊際改善幅度較出口更為顯著。我們認為,對未來半年出口可以樂觀一些。我們預計,作為全球最終需求的主要來源地的美國經濟在未來六個月將保持韌性,而和中國出口更為緊密的美國製造業最近兩個月見底企穩跡象明顯,可能會在今年四季度開始新一輪的補庫存,支撐中國出口。而全球貿易再配置效應使得中國整體出口受到的影響相對有限。
正文
基數效應是出口降幅收窄的主要貢獻因素。出口同比增速從7月的-14.5%上升至8月的-8.8%,主要是基數效應所致。2022年7月和8月同比增速分別為17.2%和6.5%。排除基數因素之後,8月相較於7月31億美元的月度環比增長基本與季節性相符。分目的地來看,對美國、東盟、歐盟8月出口同比增速分別為-9.5%、-13.3%、-19.6%,較7月上升13.6ppt、8.2ppt、1.0ppt。分品類來看,8月勞動密集型產品出口同比-10.9%,較7月改善7.6ppt。家用電器、紡織品、自動數據處理設備同比分別為11.4%、-6.4%、-18.2%,較7月改善15.0ppt、11.5ppt、10.7ppt;汽車在高基數下增速有所回落,8月同比為35.2%(7月為83.3%)。
進口降幅收窄較多,內需邊際改善明顯。進口降幅收窄同樣也有基數效應改善的貢獻,2022年7、8月進口同比分別為1.4%、-0.5%。而且排除基數效應後,進口邊際改善幅度較出口更為顯著。從量價分解來看,進口數量改善可能是主要貢獻項。8月CRB指數同比-4.3%,降幅較7月的-4.1%小幅擴大。而8月PMI進口48.9%,較7月環比上升2.1ppt,顯著高於季節性。分品類來看,銅、原有、鐵礦石、塑料進口數量同比增速都有5個百分點以上的邊際改善。
對未來半年出口可以樂觀一些。我們預計,作為全球最終需求的主要來源地的美國經濟在未來六個月將保持韌性。而和中國出口更為緊密的美國製造業最近兩個月見底企穩跡象明顯,ISM製造業PMI連續兩個月反彈,有望帶動整體發達國家製造業企穩改善,這或將對中國出口形成支撐。此外,我們預計美國製造業可能會在今年四季度開始新一輪的補庫存,支撐中國出口。而所謂的貿易脱鈎效應更多體現在中美雙邊貿易數據中,全球貿易再配置效應使得中國整體出口受到的影響相對有限。從數據來看,2023年前7月中國出口同比-5%,而美國進口同比-6%,基本保持同步。疊加基數效應,年內出口同比增速轉正或在11月。行業上來説,繼續關注以下三方面:一是中國產品競爭力結構性改善的汽車、新能源,二是美國去庫存相對比較充分的品類,例如家電等,三是關注電子產業鏈的邊際企穩。
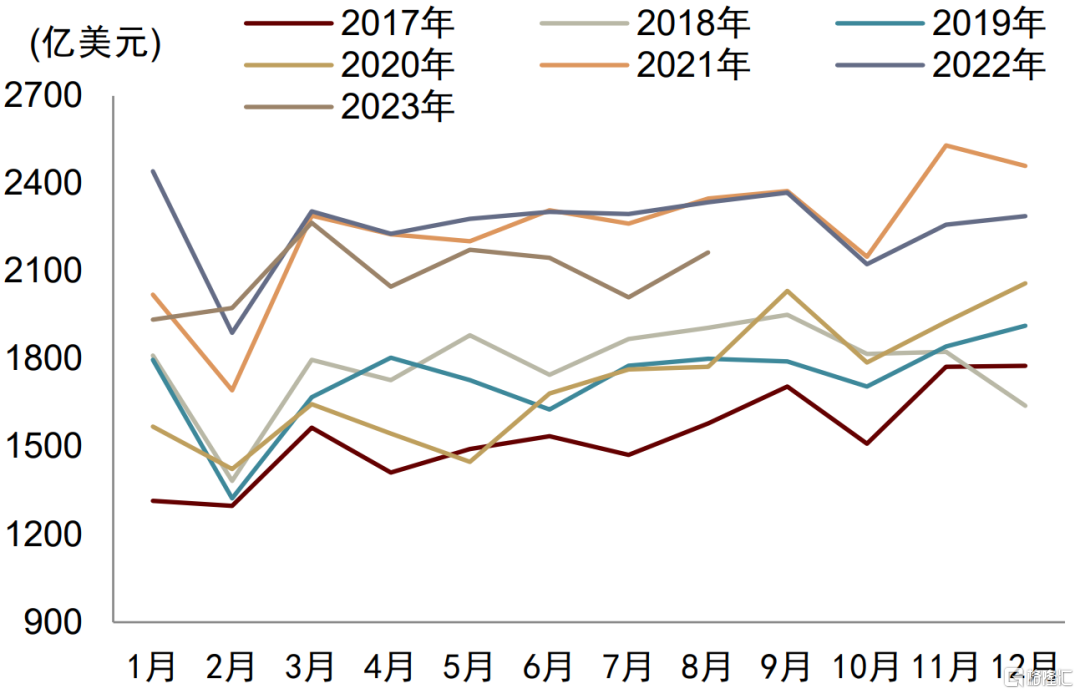
圖表1:出口當月金額

資料來源:Wind,中金公司研究部
圖表2:進口當月金額
資料來源:Wind,中金公司研究部
圖表3:中國出口同比增速分解
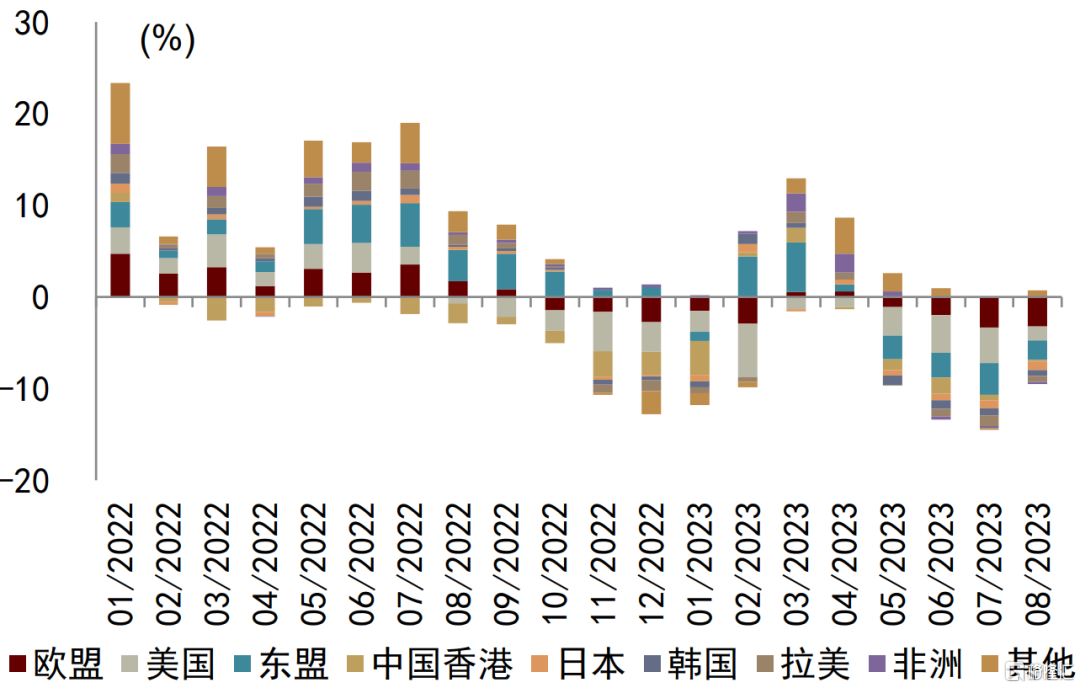
資料來源:CEIC,中金公司研究部
圖表4:發達國家製造業PMI與中國出口同比
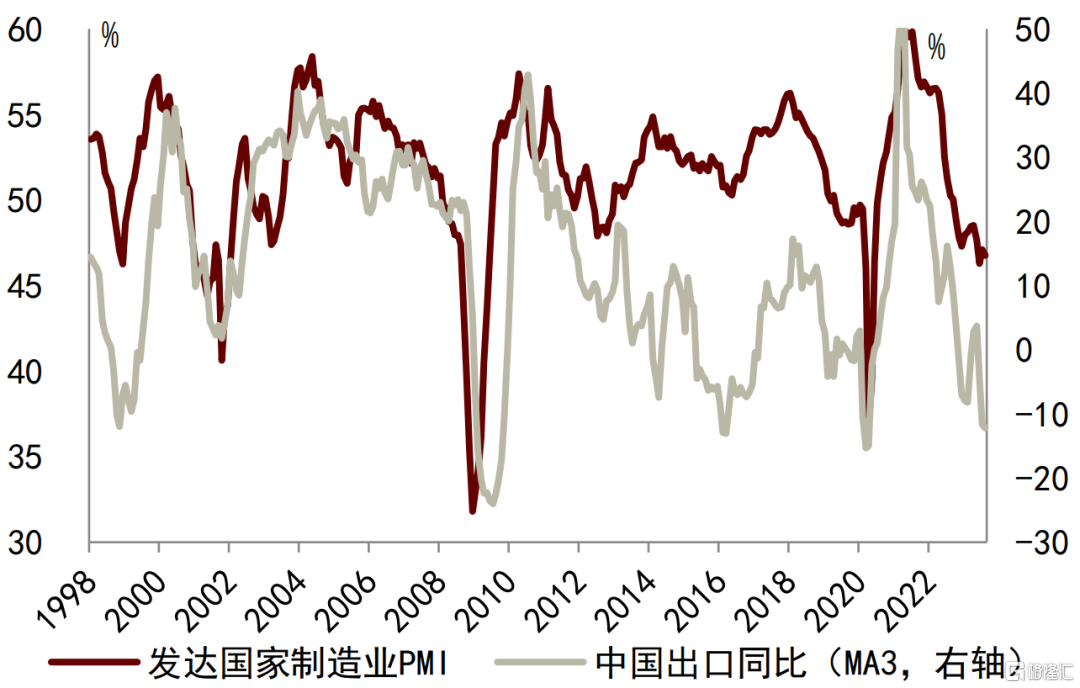
資料來源:Wind,Markit,中金公司研究部
圖表5:美國庫存環比變化與中國出口同比
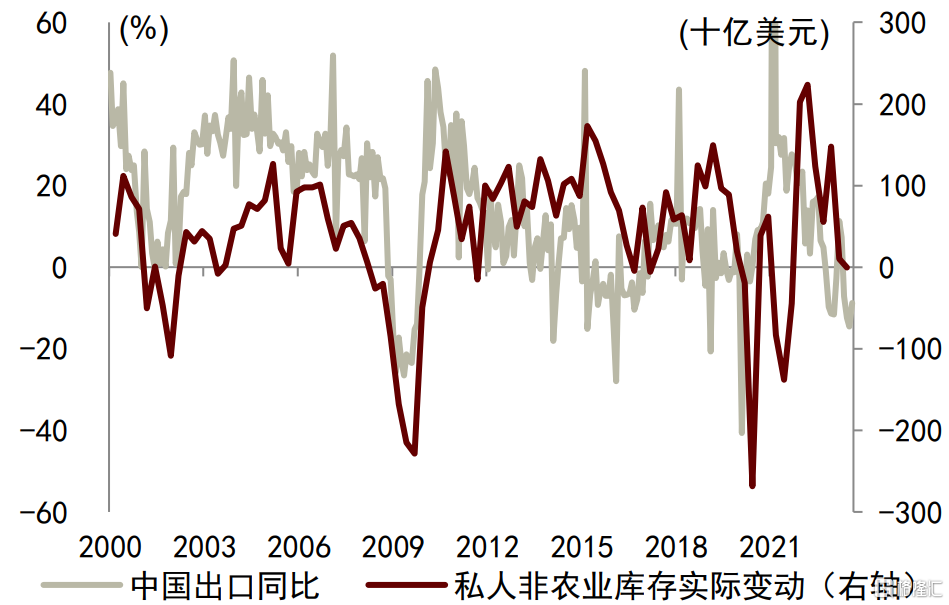
資料來源:CEIC,中金公司研究部
圖表6:中國出口同比與美國進口同比
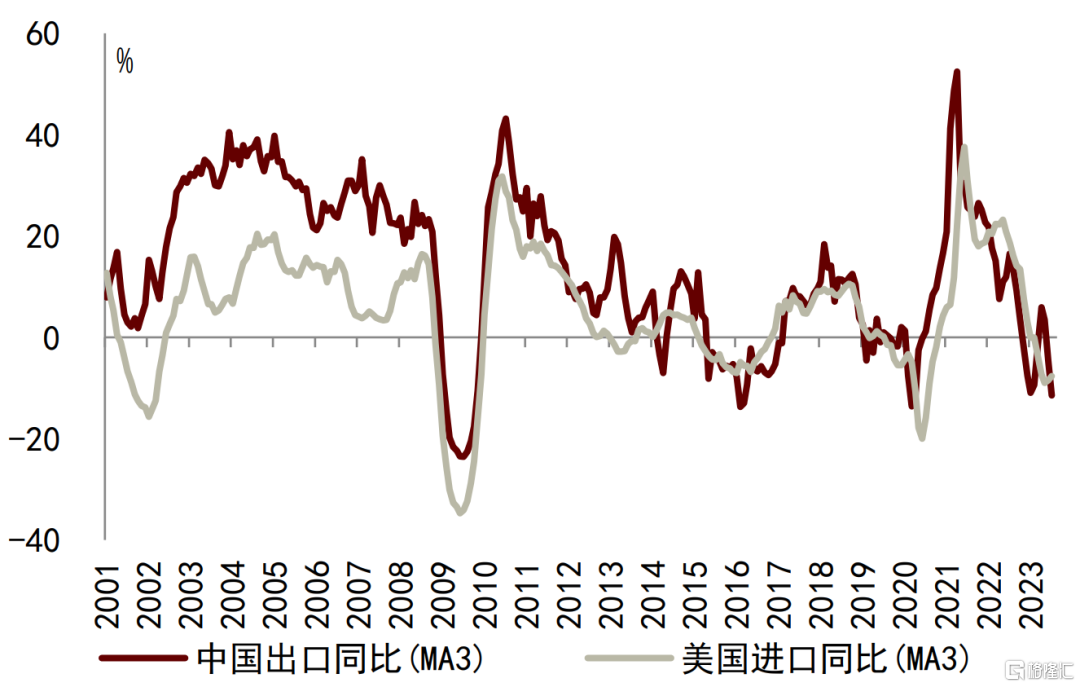
資料來源:Markit,中金公司研究部
圖表7:對主要地區出口和進口的同比增速(單位:%)
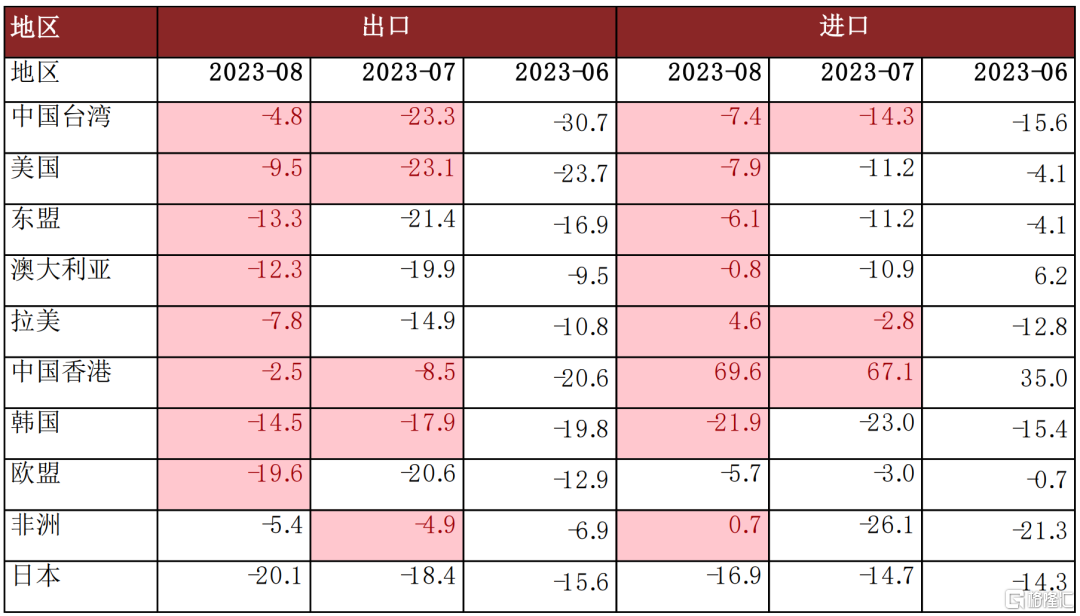
資料來源:CEIC,中金公司研究部
圖表8:主要商品出口金額的同比增速(單位:%)
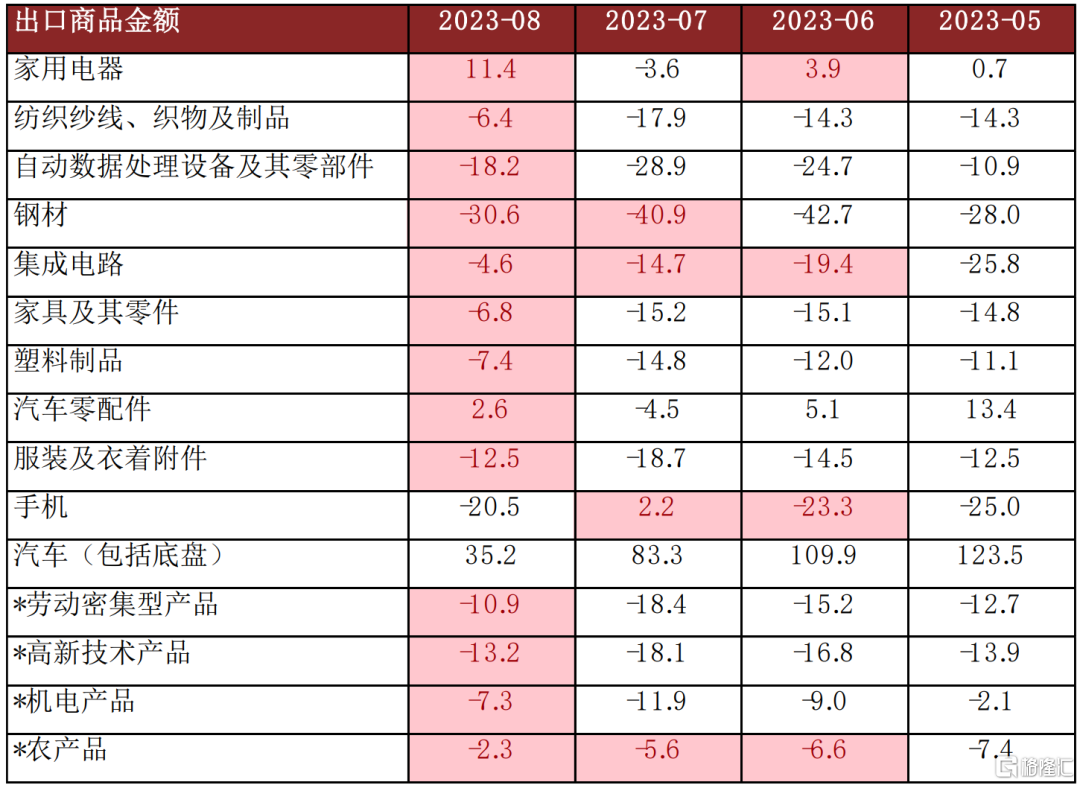
資料來源:CEIC,中金公司研究部 注:*代表大類商品,或包括本表中已列名的有關商品
圖表9:主要商品進口的同比增速(單位:%)
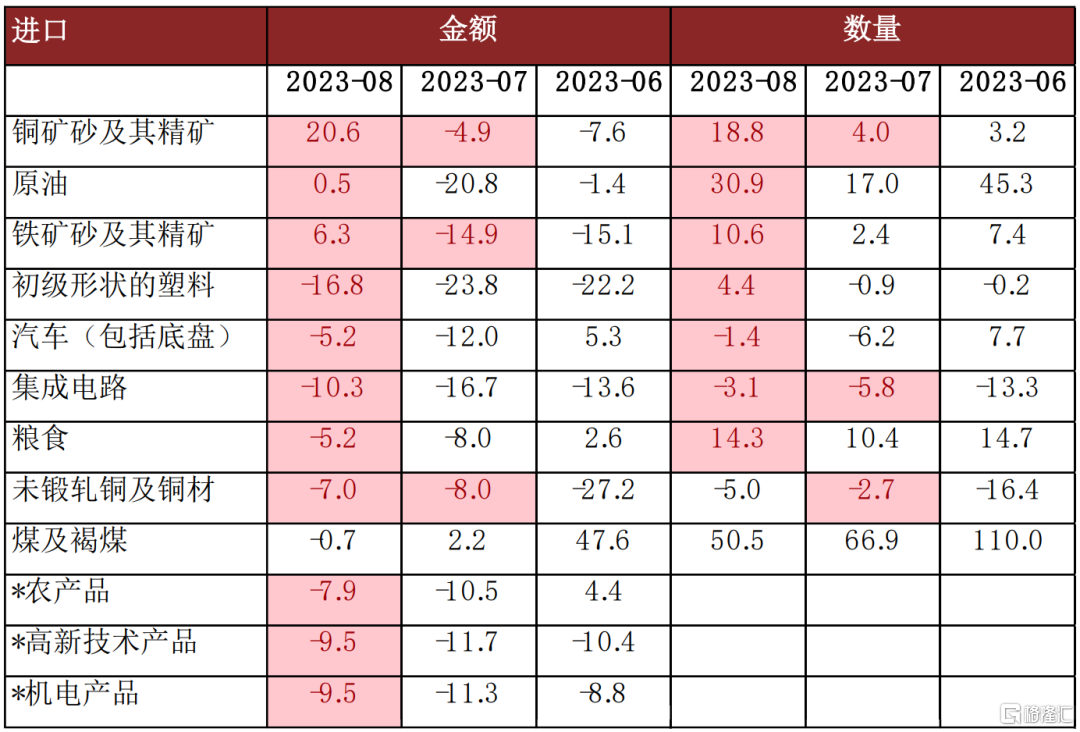
資料來源:CEIC,中金公司研究部 注:*代表大類商品,或包括本表中已列名的有關商品
注:本文摘自:2023年9月7日已經發布的《對未來半年出口可以樂觀一些——2023年8月進出口數據點評》
分析員 鄭宇馳 SAC 執證編號:S0080520110001 SFC CE Ref:BRF442
分析員 張文朗 SAC 執證編號:S0080520080009 SFC CE Ref:BFE988
Follow us
Find us on
Facebook,
Twitter ,
Instagram, and
YouTube or frequent updates on all things investing.Have a financial topic you would like to discuss? Head over to the
uSMART Community to share your thoughts and insights about the market! Click the picture below to download and explore uSMART app!

Disclaimers
uSmart Securities Limited (“uSmart”) is based on its internal research and public third party information in preparation of this article. Although uSmart uses its best endeavours to ensure the content of this article is accurate, uSmart does not guarantee the accuracy, timeliness or completeness of the information of this article and is not responsible for any views/opinions/comments in this article. Opinions, forecasts and estimations reflect uSmart’s assessment as of the date of this article and are subject to change. uSmart has no obligation to notify you or anyone of any such changes. You must make independent analysis and judgment on any matters involved in this article. uSmart and any directors, officers, employees or agents of uSmart will not be liable for any loss or damage suffered by any person in reliance on any representation or omission in the content of this article. The content of the article is for reference only and does not constitute any offer, solicitation, recommendation, opinion or guarantee of any securities, virtual assets, financial products or instruments. Regulatory authorities may restrict the trading of virtual asset-related ETFs to only investors who meet specified requirements. Any calculations or images in the article are for illustrative purposes only.
Investment involves risks and the value and income from securities may rise or fall. Past performance is not indicative of future performance. Please carefully consider your personal risk tolerance, and consult independent professional advice if necessary.


