重磅ETF來了?博時、鵬華、國泰、銀華拿到科創100ETF的首批授權
科創板100指數將於8月7日發佈,博時、鵬華、國泰、銀華在內的四家基金公司已經拿到科創100ETF的首批授權。預計相關產品上報也會很快推進,投資者有望在不久的將來借道科創100ETF參與科創板投資。
從市值來看,科創100指數公司市值主要集中在200億以下規模,佔比81%,100-200億市值公司佔比52%。
從行業劃分來看,佔比超過10%的行業依次為醫藥(29%)、電子(23%)、機械(16%)、計算機(10%)。從升跌幅來看,年初至今區間,40只為上升,60只為下跌,其中,升幅超過20%的有21只,升幅前十的為財富趨勢、唯捷創芯、虹軟科技、拓荊科技、雲從科技、信科移動、芯源微、華海清科、金宏氣體、新益昌。
從成長性來看,2022年科創100收入與歸母淨利潤增速高於科創板整體,低於科創50,ROE與研發費用率高於科創50與科創板整體。
從基金持倉看,2023年基金半年報持倉數據顯示,公募基金持倉科創板市值為2880.63億元,佔公募基金總持倉市值比例為9.4%,較2023年Q1提升177.82億元,季度增長6.6%。基金持股市值前十的依次為金山辦公、中芯國際、中微公司、天合光能、傳音控股、瀾起科技、寒武紀-U、晶科能源、拓荊科技、中控技術。增持電子、計算機、醫藥與機械設備行業,減持電新與軍工。
分行業來看,公募持倉科創板公司主要集中在電子、計算機、電力設備、醫藥生物、機械設備等行業,持倉市值第一的行業為電子行業,持倉市值為1375.94億元,佔總持倉市值比例為47.77%,較上季度增長8.88%;第二為計算機,持倉市值為467.44億元,佔總持倉市值的16.23%,較上季度增長0.52%;其次為電力設備與新能源行業,持倉市值為371.01億元,佔總持倉市值的12.88%,較上季度減少473%;醫藥生物、機械設備增持,持倉佔比分別為8.27%和8.13%;國防軍工遭到減持,持倉佔比為3.83%。
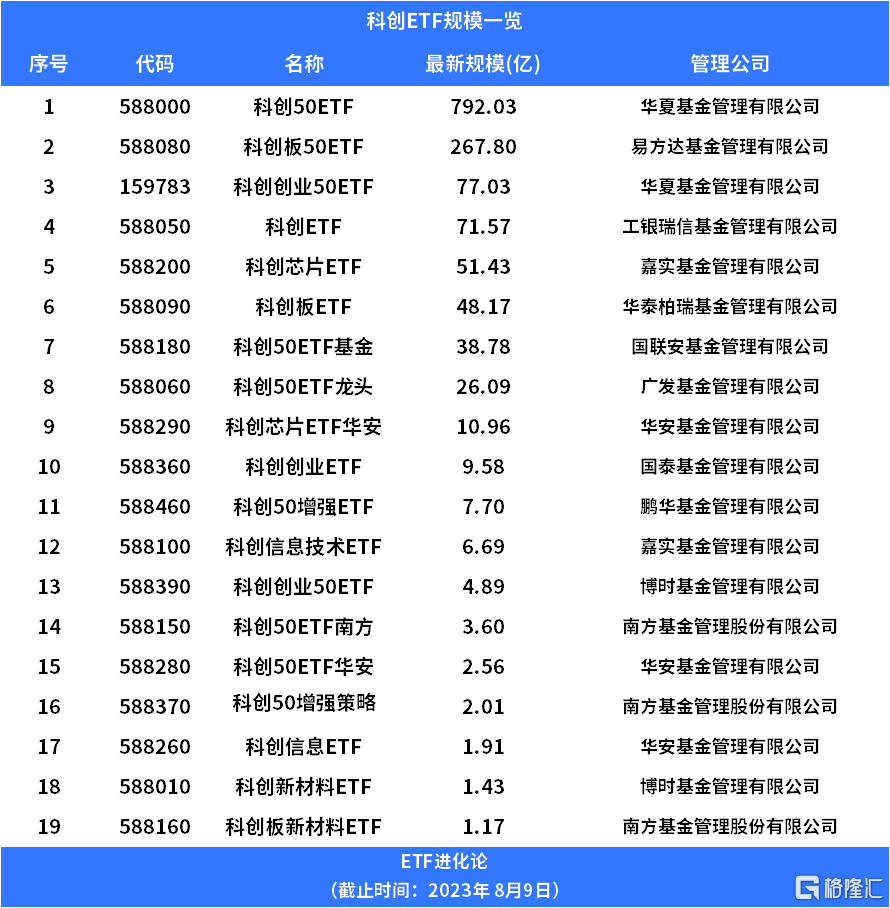
截至8月7日,共有30只跟蹤科創主題指數的ETF,合計規模超1500億元,其中,華夏科創50ETF規模達到792億元,位居首位,易方達科創板50ETF規模也達到267億元。包括這兩隻ETF在內,規模超過20億元的科創主題ETF有8只。
銀河證券認為,隨着經濟逐步復甦,下游景氣度不斷回暖,疊加AIGC、數字經濟、信創政策的推進,與應用場景的不斷打開落地,科創板估值有望觸底回升,優質個股配置價值逐漸顯現,可以關注AIGC、信創與數字經濟賽道下的計算機軟硬件投資機會,以及去庫存預期修復下的半導體板塊、下游工業景氣度回升的高端製造等板塊,有技術優勢壁壘、競爭格局明確的優質個股的投資機會。
Follow us
Find us on
Facebook,
Twitter ,
Instagram, and
YouTube or frequent updates on all things investing.Have a financial topic you would like to discuss? Head over to the
uSMART Community to share your thoughts and insights about the market! Click the picture below to download and explore uSMART app!

Disclaimers
uSmart Securities Limited (“uSmart”) is based on its internal research and public third party information in preparation of this article. Although uSmart uses its best endeavours to ensure the content of this article is accurate, uSmart does not guarantee the accuracy, timeliness or completeness of the information of this article and is not responsible for any views/opinions/comments in this article. Opinions, forecasts and estimations reflect uSmart’s assessment as of the date of this article and are subject to change. uSmart has no obligation to notify you or anyone of any such changes. You must make independent analysis and judgment on any matters involved in this article. uSmart and any directors, officers, employees or agents of uSmart will not be liable for any loss or damage suffered by any person in reliance on any representation or omission in the content of this article. The content of the article is for reference only and does not constitute any offer, solicitation, recommendation, opinion or guarantee of any securities, virtual assets, financial products or instruments. Regulatory authorities may restrict the trading of virtual asset-related ETFs to only investors who meet specified requirements. Any calculations or images in the article are for illustrative purposes only.
Investment involves risks and the value and income from securities may rise or fall. Past performance is not indicative of future performance. Please carefully consider your personal risk tolerance, and consult independent professional advice if necessary.


