2023年中國500強企業榜單:國家電網營收最高,工商銀行淨利最多(附完整名單)
本文整合自:財富中文網
7月25日,財富中文網發佈了2023年《財富》中國500強排行榜。整體來看,今年500家上榜的中國公司在2022年的總營業收入達到15萬億美元,淨利潤達到7171億美元。
國家電網營收5300億美元位居榜首
互聯網企業淡出前十
在500強Top10榜單中,從營收來看,國家電網有限公司以5300億美元的營收位居榜首,中國石油和中國石化分列榜單第2位和第3位。位列第4位的是中國建築集團。
蘋果最大代工企業鴻海精密位列第5,是排名最高的台灣地區公司。
中國平安保險(集團)股份有限公司是榜單前10位內唯一的大陸民營企業,位列第9位。
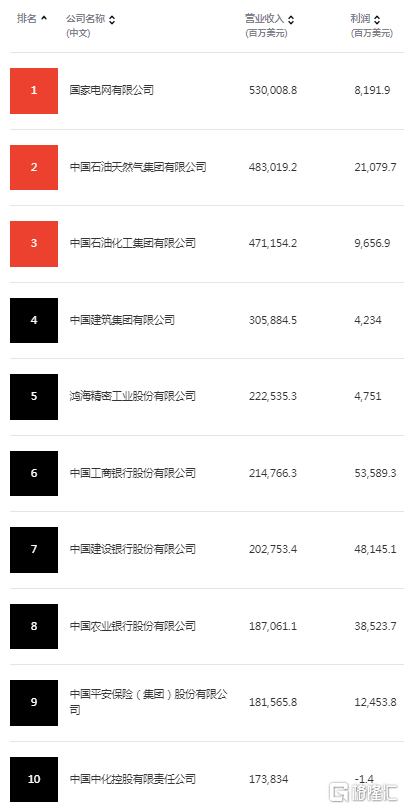
值得注意的是,相較2022年《財富》中國500強排行榜,2023年中國500強Top10榜單中沒有互聯網平台企業。
新能源領域的兩家頭部公司,營收相較上年增長巨大。寧德時代營收達到488億美元,較上年增長141%。比亞迪營收增長92%,達到630億美元,歸母淨利潤同比增長更是超過四倍,達到24億美元。
工商銀行最賺錢
從盈利能力來看,最賺錢的10家上榜公司中,除五家商業銀行和中石油、中海油、中移動之外,兩傢俬營企業也進入了前十位,其中台積公司以333億美元淨利潤排在利潤榜第5位,騰訊的淨利潤比去年下降了19%,但仍以超過279億美元的淨利潤排在利潤榜第6位。
這十家公司在去年的總利潤約為3,087億美元,約佔上榜公司利潤總和的43%。

淨利潤率方面,排名前五的公司中,有三家是鋰電池產業鏈的公司,分別是天齊鋰業、青海鹽湖工業和贛鋒鋰業集團,其中天齊鋰業的淨利潤率高達59%,位列利潤率榜第二位。位列利潤率榜榜首的是九安醫療,憑藉核酸檢測試劑在2022年的強勁銷量,該公司的利潤率超過60%。中國台灣地區的長榮海運,以53%的利潤率排在利潤率榜第三位。
64家上榜公司未能盈利
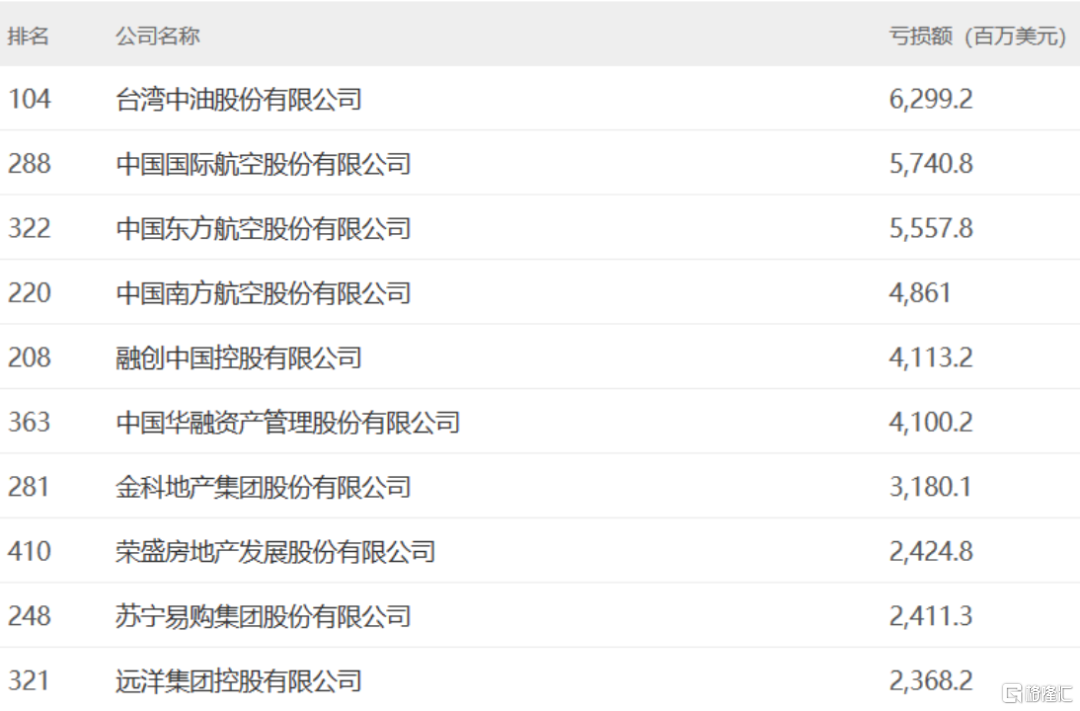
《財富》中國500強中共計有64家上榜公司未能盈利。虧損榜前十家公司中,共有三家航空公司,四家房地產公司。
三家虧損的航空公司中,中國國際航空虧損57.4億美元,東方航空虧損55.57億美元,南方航空48.61億美元。
四家虧損的房地產公司中,融創中國虧損41.13億美元,排名第五;金科地產虧損31.80億美元,排名第7;榮盛房地產虧損24.24億美元,排名第八,遠洋集團虧損23.68億美元,排名第十。

金屬產品行業上榜公司最多
35家房企上榜
從行業角度來看,在大宗商品價格上升的背景下,上榜公司數量最多的行業是金屬產品行業,共有56家公司上榜,上榜公司收入總額達1.4萬億美元。前三的有色金屬企業為正威國際集團有限公司、中國鋁業集團有限公司和江西銅業集團有限公司。
房地產行業上班企業35家,比去年減少了9家,但依舊排名第二,僅次於今年金屬產品行業的56家。
排名最高的房企是萬科,位列第56位,營收為749億美元。其次是保利,位列第60位,營收為676.96億美元;第三是綠地控股,位列第63位,營收648.02億美元。
化學品企業上班24家排名第三。
在汽車行業中,造車新勢力“蔚小理”均登上了榜單。同時,比亞迪營收增幅最大,同比增長92.4%。上榜的15家車企中,有7家未能實現營收增長。
上榜公司數量最少的行業是信息技術服務、食品服務業、廣吿及市場營銷。

附:2023年中國500強完整榜單

Follow us
Find us on
Facebook,
Twitter ,
Instagram, and
YouTube or frequent updates on all things investing.Have a financial topic you would like to discuss? Head over to the
uSMART Community to share your thoughts and insights about the market! Click the picture below to download and explore uSMART app!

Disclaimers
uSmart Securities Limited (“uSmart”) is based on its internal research and public third party information in preparation of this article. Although uSmart uses its best endeavours to ensure the content of this article is accurate, uSmart does not guarantee the accuracy, timeliness or completeness of the information of this article and is not responsible for any views/opinions/comments in this article. Opinions, forecasts and estimations reflect uSmart’s assessment as of the date of this article and are subject to change. uSmart has no obligation to notify you or anyone of any such changes. You must make independent analysis and judgment on any matters involved in this article. uSmart and any directors, officers, employees or agents of uSmart will not be liable for any loss or damage suffered by any person in reliance on any representation or omission in the content of this article. The content of the article is for reference only and does not constitute any offer, solicitation, recommendation, opinion or guarantee of any securities, virtual assets, financial products or instruments. Regulatory authorities may restrict the trading of virtual asset-related ETFs to only investors who meet specified requirements. Any calculations or images in the article are for illustrative purposes only.
Investment involves risks and the value and income from securities may rise or fall. Past performance is not indicative of future performance. Please carefully consider your personal risk tolerance, and consult independent professional advice if necessary.


