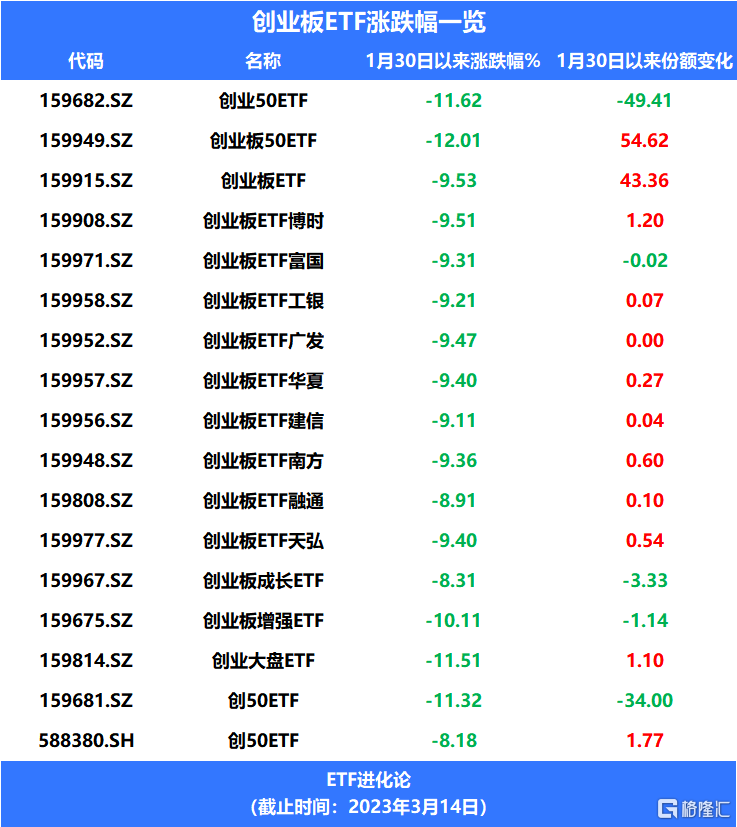
創業板ETF跌近10%後,資金在湧入
創業板ETF自1月30日以來,持續下跌,跌幅近10%。
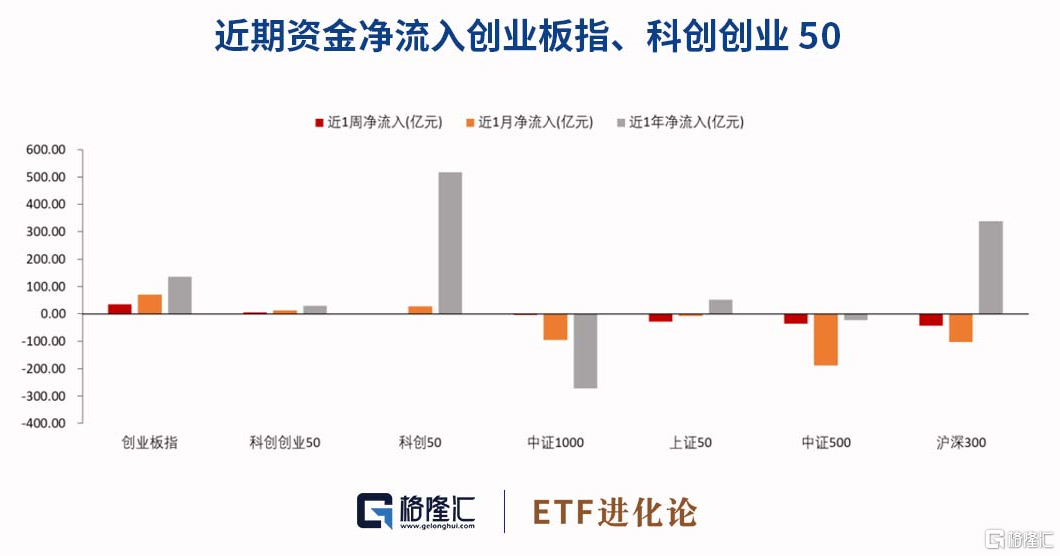
從資金面上看,ETF資金近期持續淨流入創業板指、雙創50。上週(2023年3月03日-2023年3月9日)ETF資金淨流入創業板指最多,單週淨流入額34.03億元,其次為科創創業50,資金淨流入5.66億元。
上週ETF資金淨流出滬深300最多,流出額42.58億元,其次為中證500,流出額35.78億元、上證50,資金流出29.0億元,中證1000資金流出4.41億元,科創50資金流出0.72億元。
易方達表示,近期創業板受市場關注主要還有多方面的的原因:一是針對科技創新的政策與改革措施不斷;二是估值刷新近年來新低,股價逼近去年10月低位,數據顯示,11月以來創業板先升後跌,已接近去年10月底部,估值持續下行至2019年初水平;三是基本面業績預期向好,部分資金可能提前佈局。
從估值上看,目前創業板50指數TTM市盈率不足35倍,處於過去5年13%分位數,估值刷新近年來新低,股價逼近去年10月低位,數據顯示,11月以來創業板先升後跌,已接近去年10月底部,估值持續下行至2019年初水平。
從創業板行業分佈上,指數高度覆蓋成長行業,前三大權重行業分別為電力設備、醫藥生物和電子,合計權重達67%,其中電力設備受益於碳中和目標下能源轉型升級,醫藥和電子則分別受益於人口老齡化趨勢和國產替代進程加速
具體指數成分股來看,目前指數權重股多為成長性高的龍頭企業,其中寧德時代的權重佔比達到16%,前十大權重股集中度為49%,具有比較明顯的龍頭效應,且均為各自細分領域的代表性企業。
從業績上看,目前創業板已有96家公司披露2022年業績快報,業績披露整體質量較高。
其中歸母淨利潤正增長公司67家,佔比達到三分之二以上,67家公司中48家歸母淨利潤增速超過20%,23家增速超過50%。
創業板龍頭寧德時代,2022年公司實現營收3286億元,同比增長152%;扣非歸母淨利潤282億元,同比增長110%。
陽光電源2022年報業績預吿顯示,歸母淨利潤實現32至38億元,同比增長62%至74%。
匯川技術2022年實現營業總收入228.63億元,同比增長27.42%;實現扣除非經常性損益後的淨利潤34.14億元,同比增長16.98%。
愛美客發佈2022年年報,全年實現營業收入19.4億元,同比增長33.9%;實現歸母淨利潤12.6億元,同比增長31.9%。
鵬華基金談到,近期以寧德時代、愛美客為代表的重要成份股陸續披露2022年年報,無論是營收還是淨利潤均實現大幅增長,根據分析師預期數據,創業板50指數2023年有望繼續保持35%以上的營收和利潤增速,這將夯實指數的基本面基礎並帶來向上動力。
廣發證券則表示,自春節之後,創業板指數高開跌走,下跌一月有餘,從小級別週期看,形成了5浪下行的形態,同時出現底背弛,這在古典技術分析方法論中屬於下跌末期特徵,由於當前市場大體不存在系統性風險,整體屬於震盪市,那麼震盪市中這種技術面特徵是比較難得的,當前屬於勝率較高的位置。
Follow us
Find us on
Facebook,
Twitter ,
Instagram, and
YouTube or frequent updates on all things investing.Have a financial topic you would like to discuss? Head over to the
uSMART Community to share your thoughts and insights about the market! Click the picture below to download and explore uSMART app!

Disclaimers
uSmart Securities Limited (“uSmart”) is based on its internal research and public third party information in preparation of this article. Although uSmart uses its best endeavours to ensure the content of this article is accurate, uSmart does not guarantee the accuracy, timeliness or completeness of the information of this article and is not responsible for any views/opinions/comments in this article. Opinions, forecasts and estimations reflect uSmart’s assessment as of the date of this article and are subject to change. uSmart has no obligation to notify you or anyone of any such changes. You must make independent analysis and judgment on any matters involved in this article. uSmart and any directors, officers, employees or agents of uSmart will not be liable for any loss or damage suffered by any person in reliance on any representation or omission in the content of this article. The content of the article is for reference only and does not constitute any offer, solicitation, recommendation, opinion or guarantee of any securities, virtual assets, financial products or instruments. Regulatory authorities may restrict the trading of virtual asset-related ETFs to only investors who meet specified requirements. Any calculations or images in the article are for illustrative purposes only.
Investment involves risks and the value and income from securities may rise or fall. Past performance is not indicative of future performance. Please carefully consider your personal risk tolerance, and consult independent professional advice if necessary.


